What will you be able to do after following this guide?
Create & import contacts → customize columns and advanced filtering → assign responsible persons → read the Contact/Company Analytics dashboard → view the 360° Activity timeline of each customer and the entire contact list → track the Team Activity Overview — all right in CRM, no need to export to Excel.
Prepare in advance
1. The GTG CRM account is logged in — To access the Contacts / Business menu
2. CRM data viewing permissions — Required to open the list, Analytics and Operations tabs
3. (Recommended) Connect your Facebook/Zalo/Email channels in Settings — To have contacts automatically added and your timeline data available.
1. Access CRM
- Log in to your GTG CRM account.
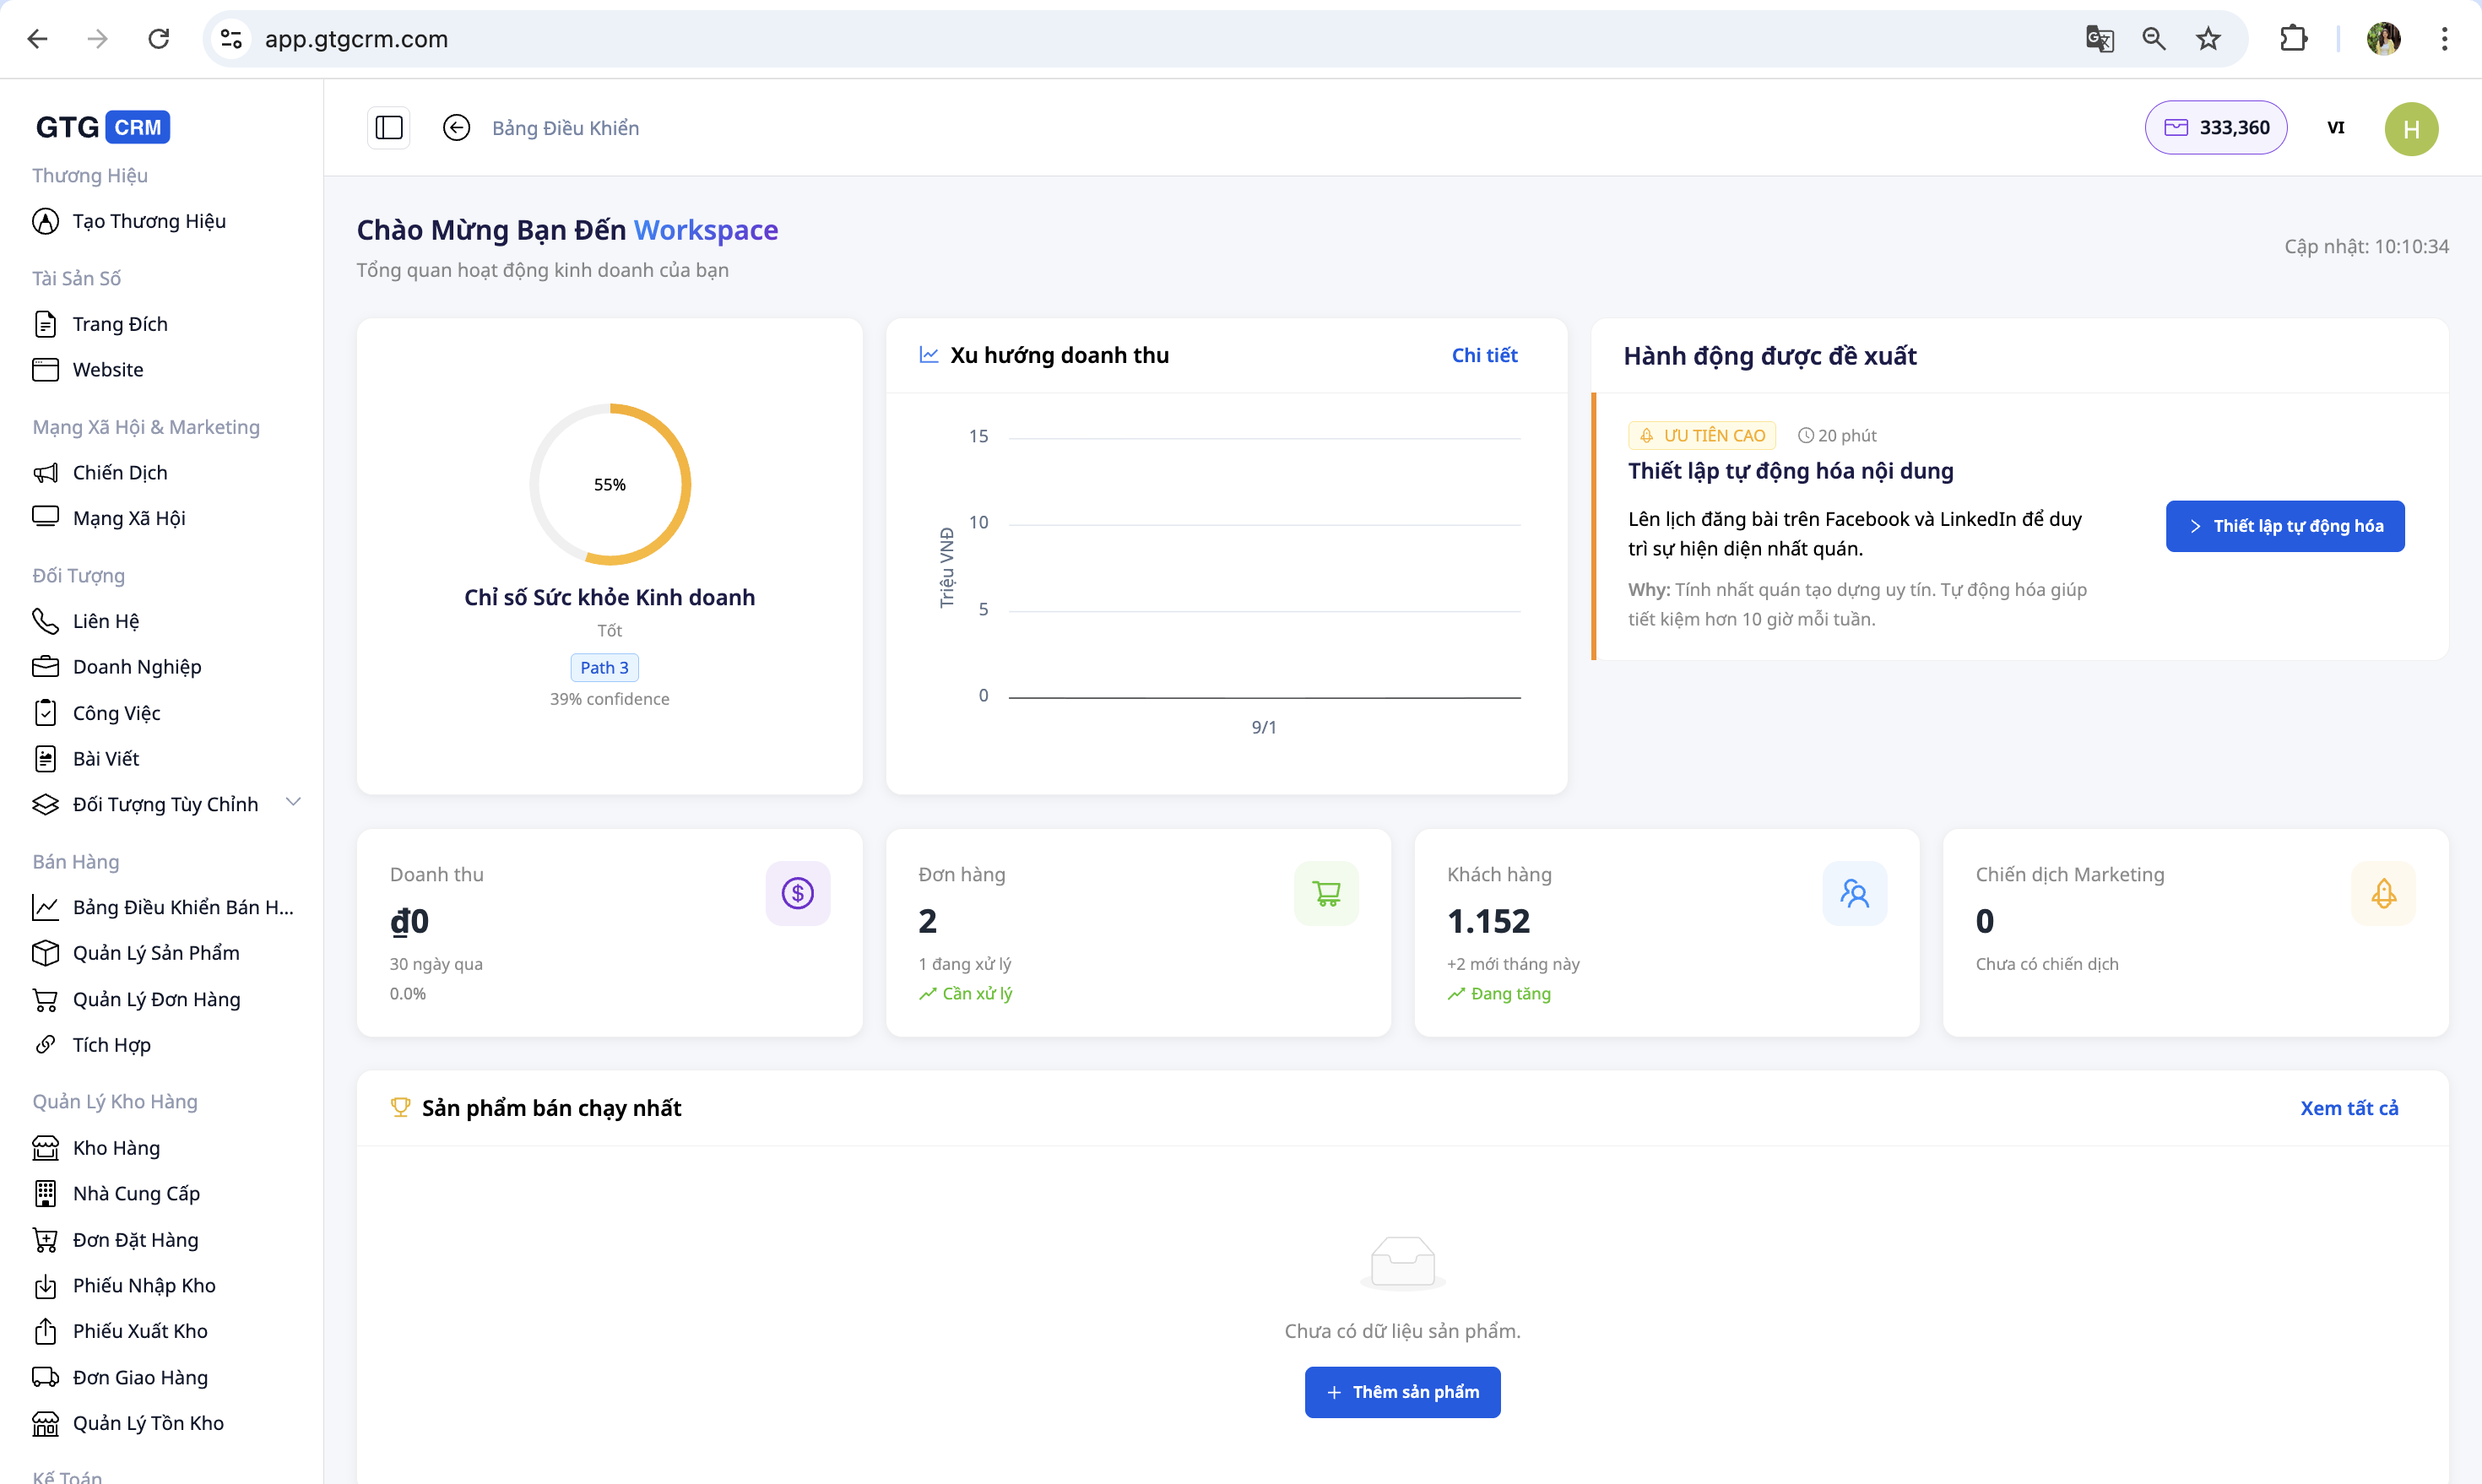
- From the menu bar on the left, click "Contact" .
- You will see a list of all contacts (customers) in the system.
✅ Expected result : The screen displays a list of contacts with the tabs List · Activities · Automation · Analytics at the top.
2. View the Contact List
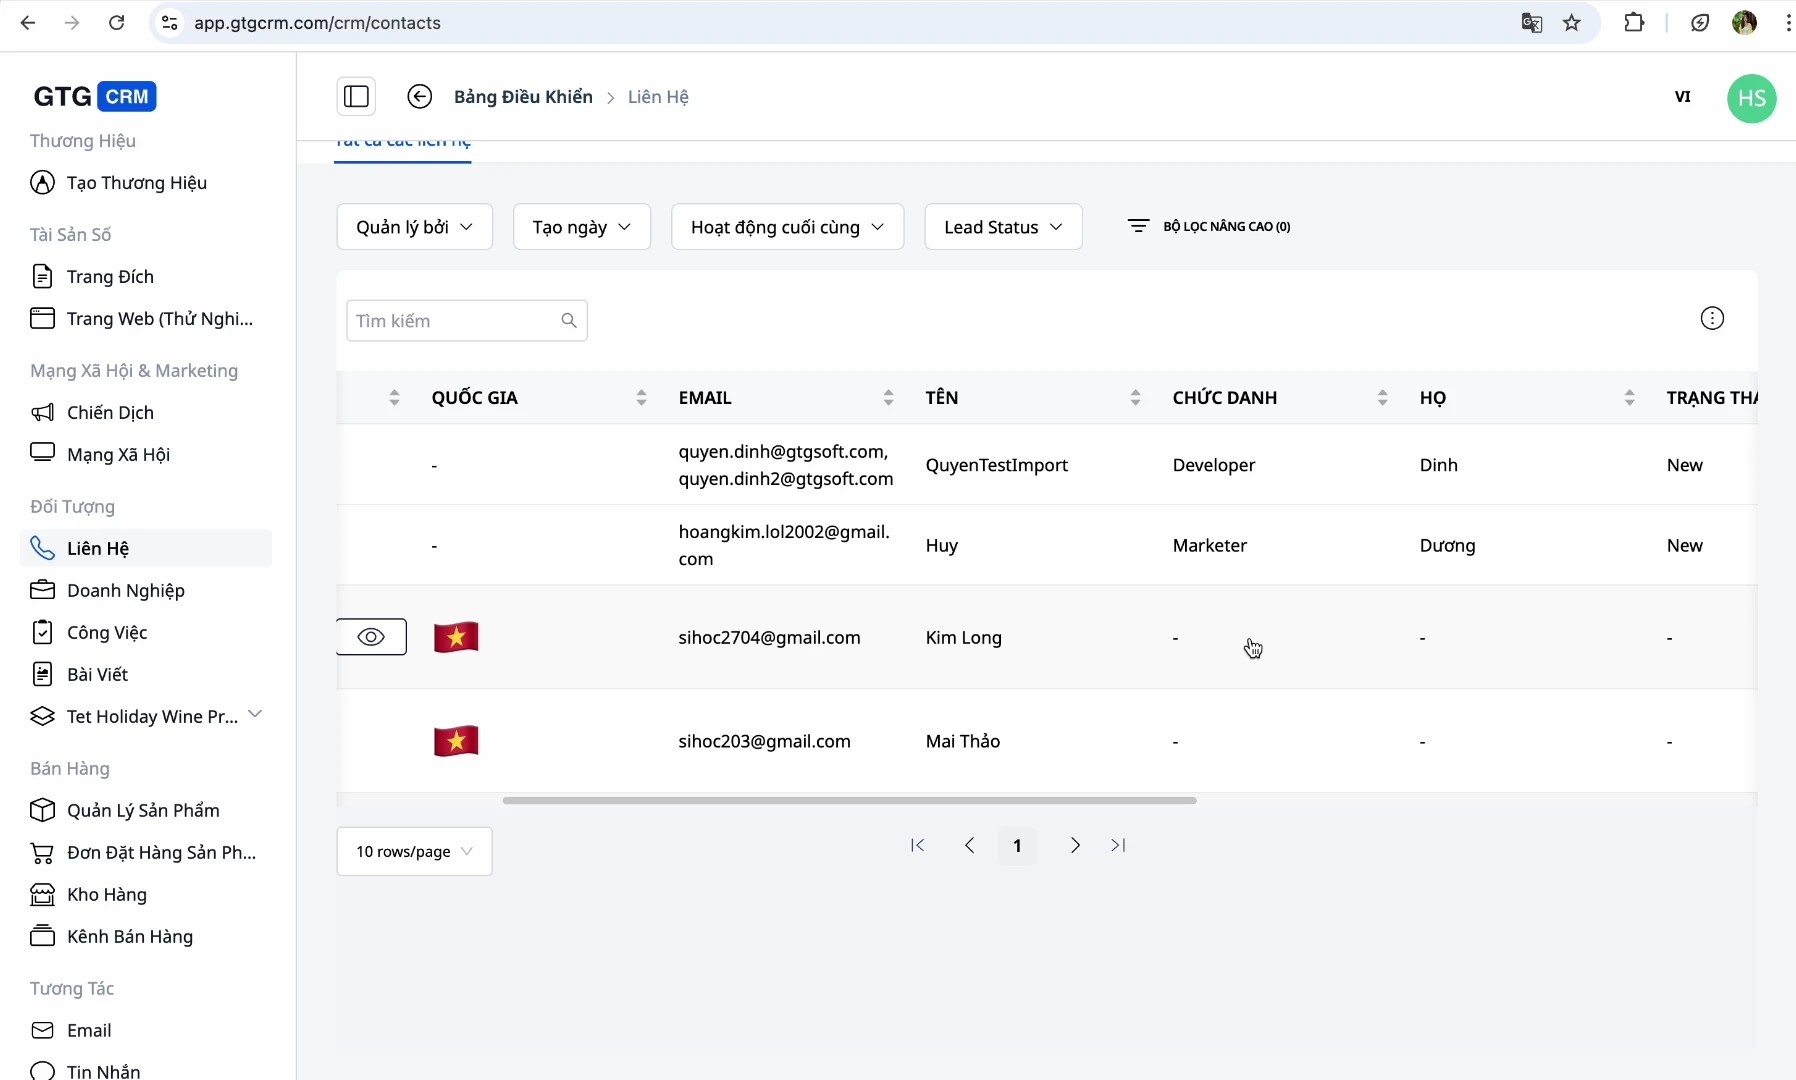
The contact list displays the following columns: Name · Email · Phone Number · Country · Status (New, In Progress, Converted…) · Source (Facebook, Zalo, Landing Page…) · Person in Charge .
Contacts are automatically routed to the CRM from Facebook Messenger , Gmail , and Landing Page/Live Chat .
✅ Expected outcome : The list displays the correct information columns and automatically updates when new customers arrive from connected channels.
3. Create a New Contact
Use this when you receive a customer from a source that the system cannot automatically retrieve (phone call, in-person meeting, etc.).
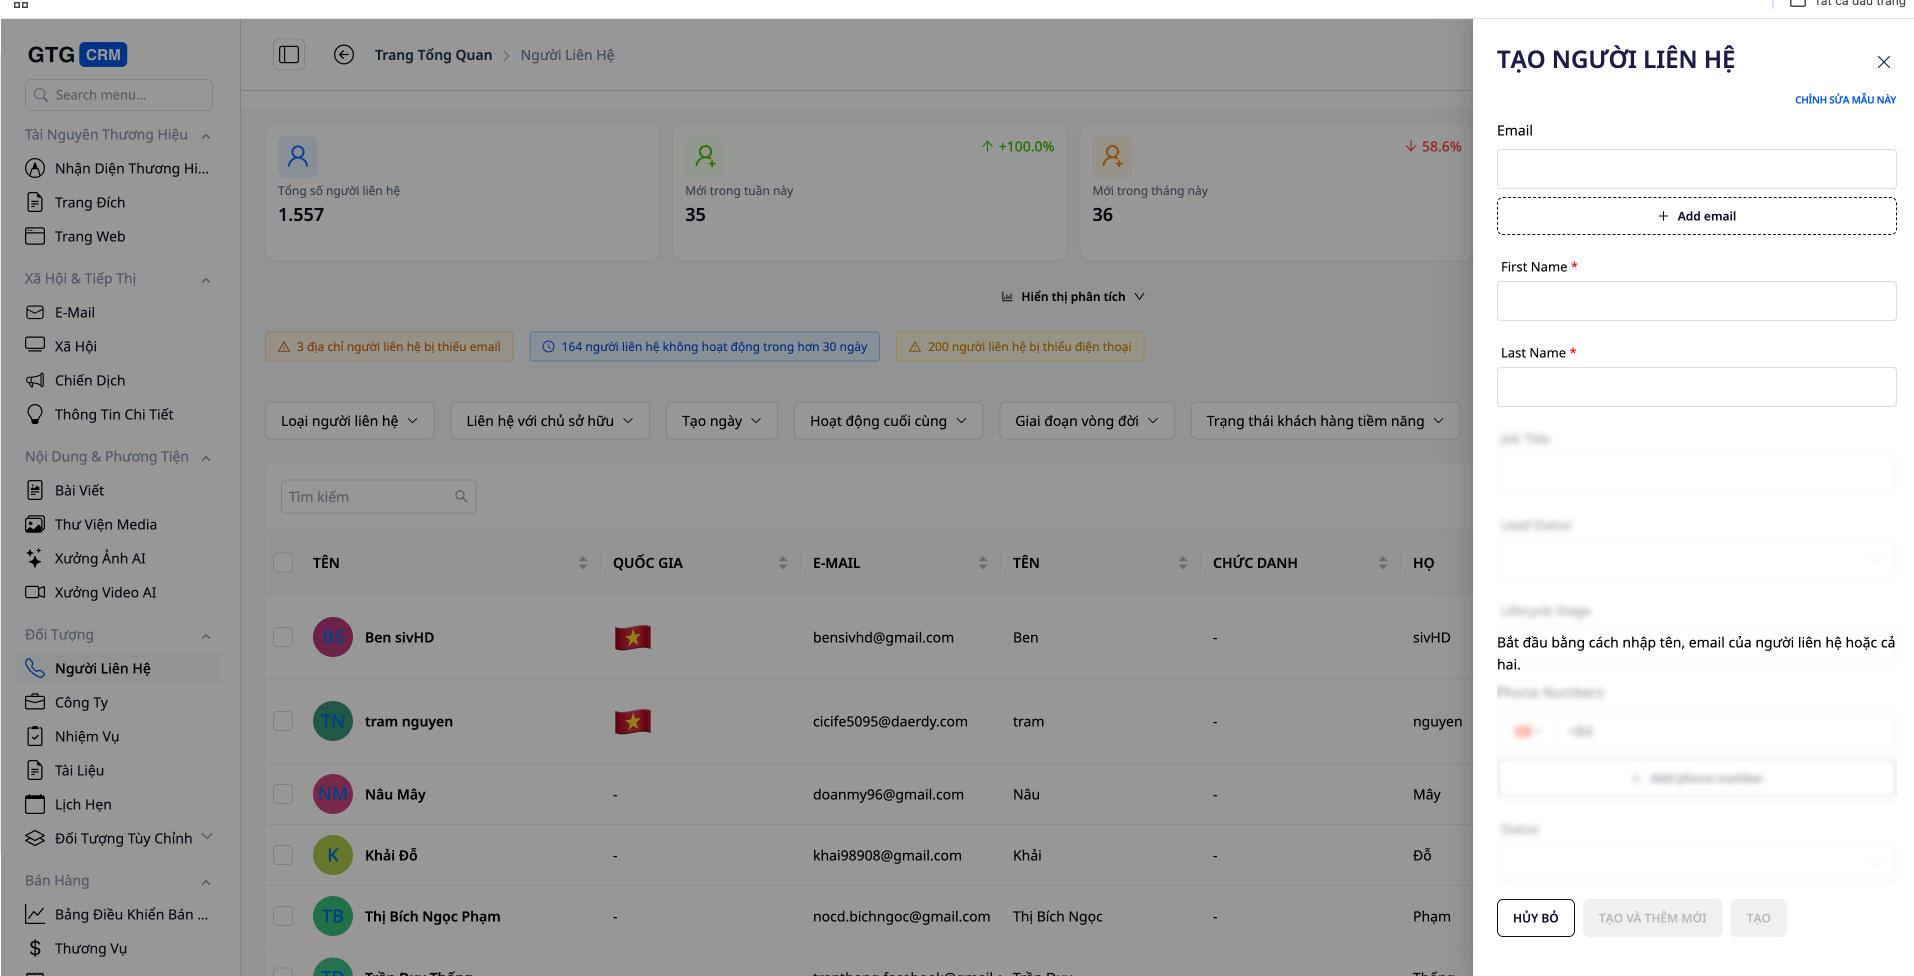
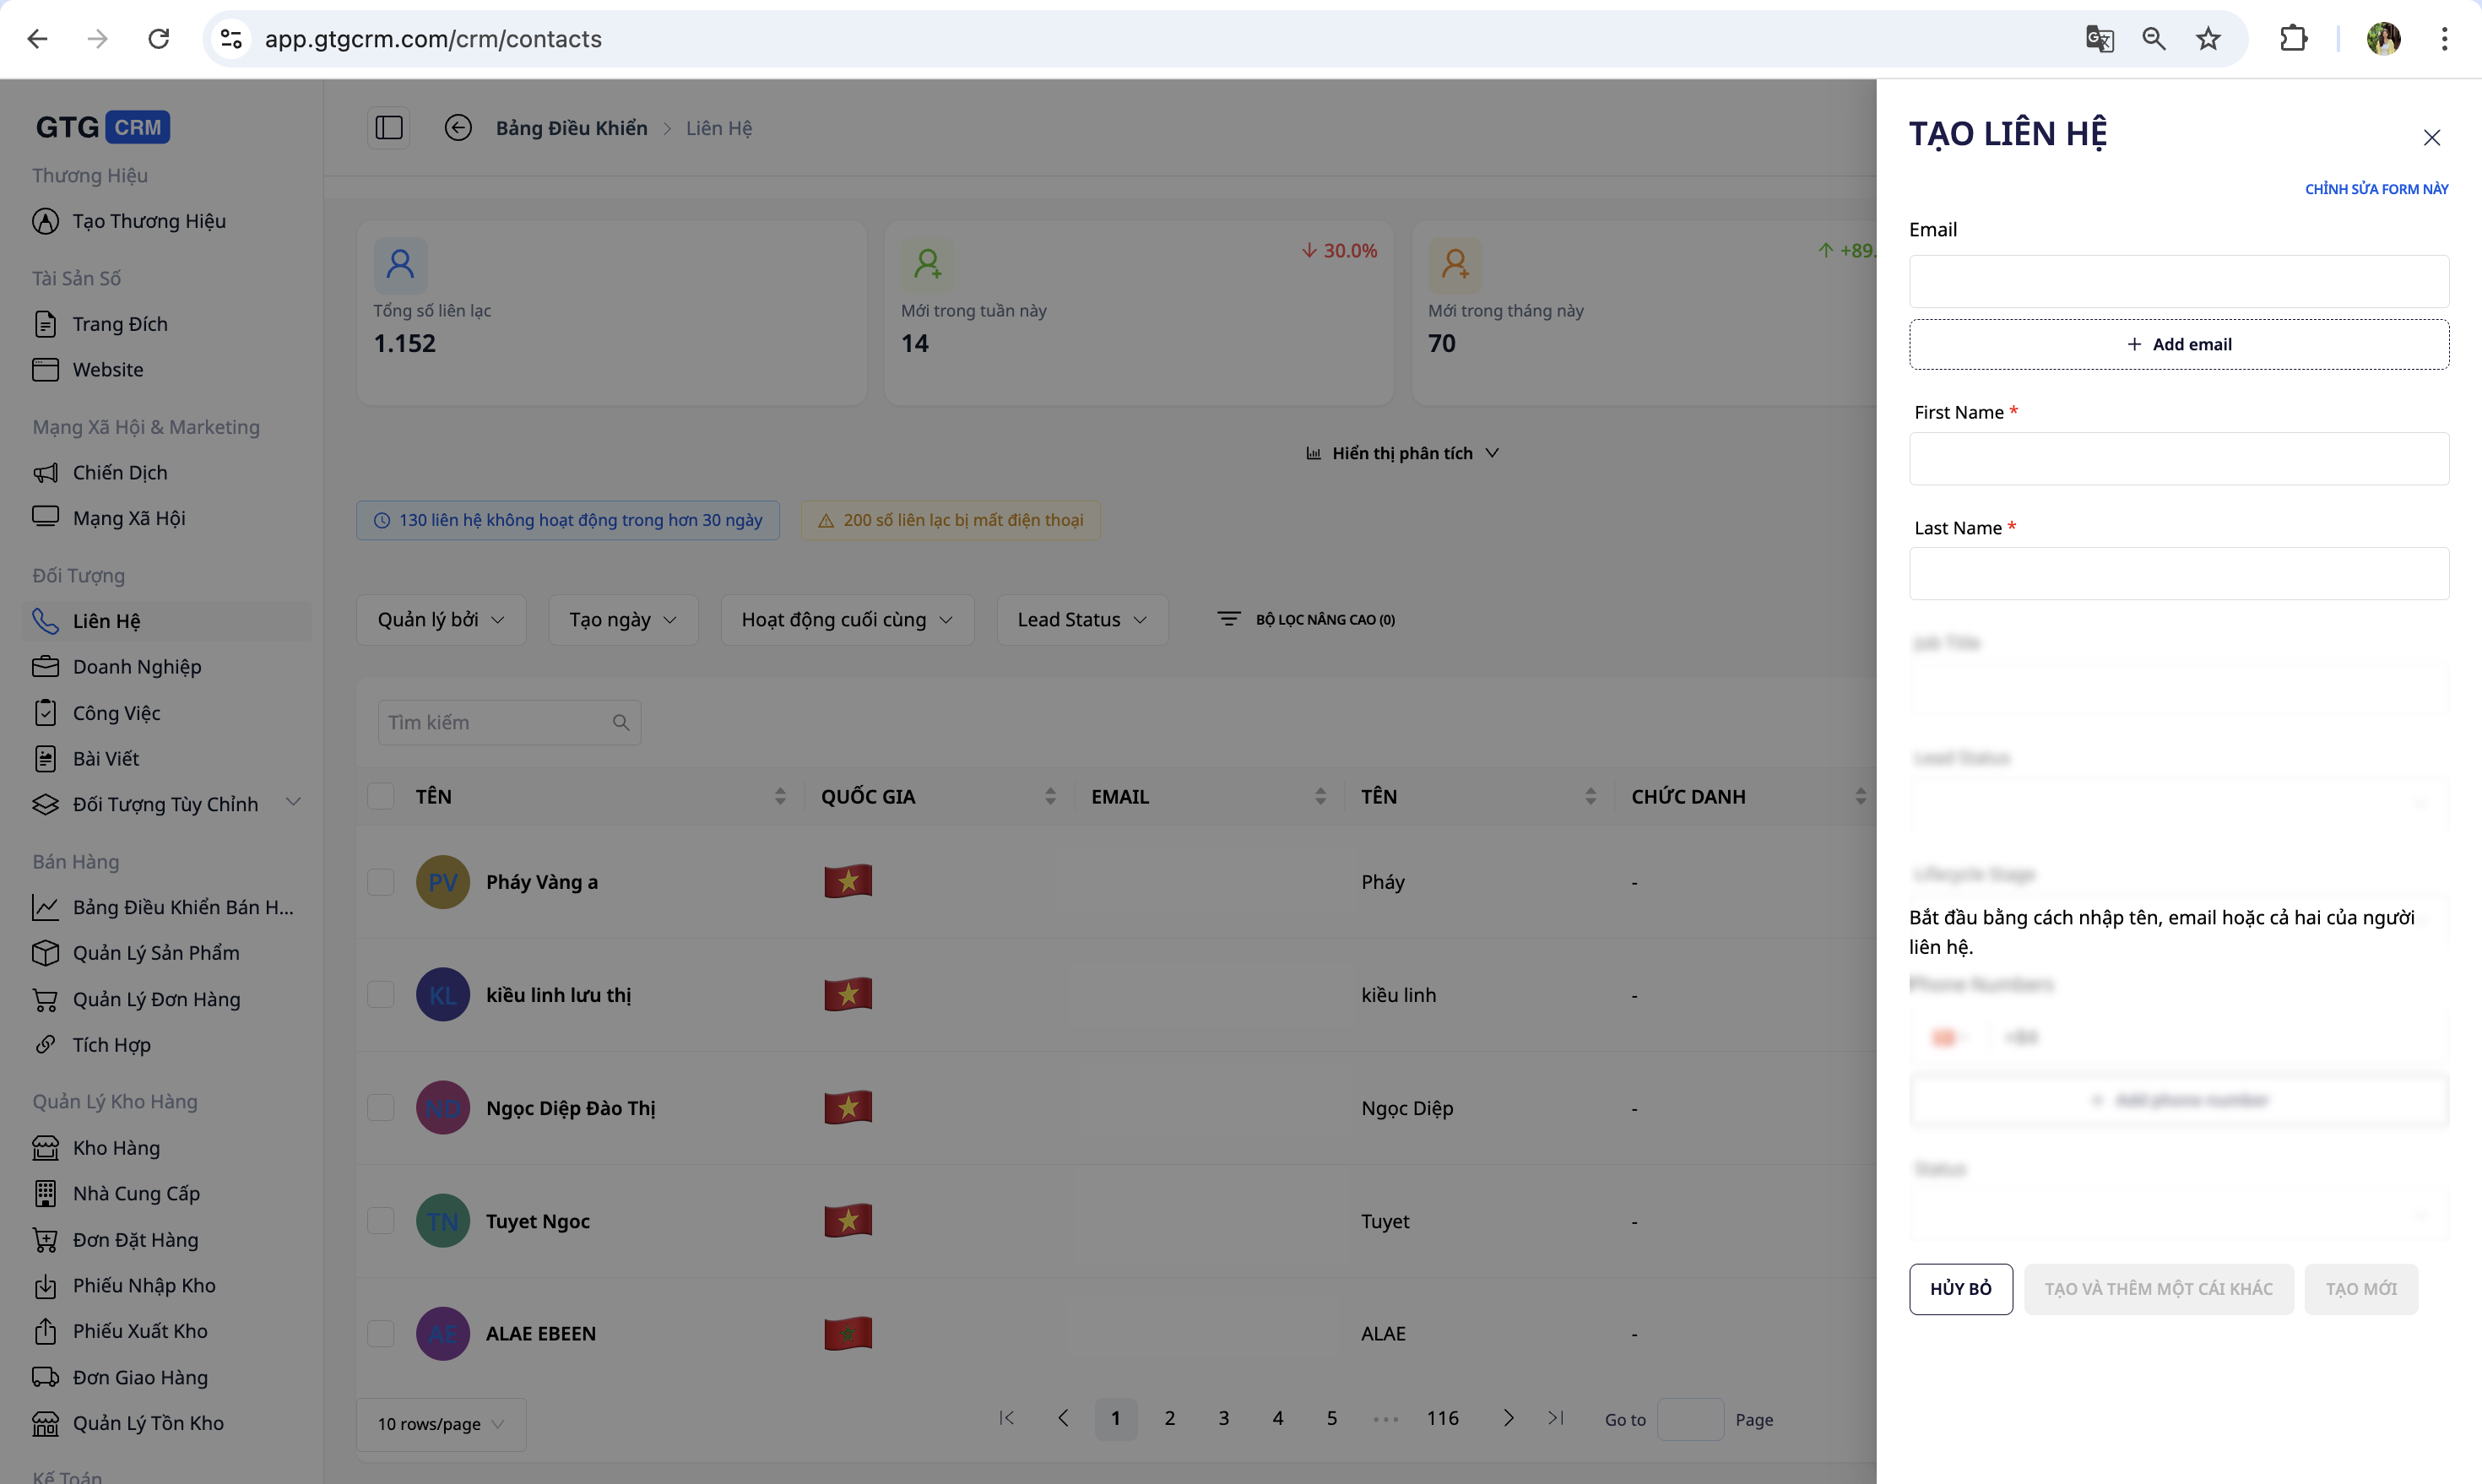
- Click the "Create Contact" button in the upper right corner of the screen.
- Fill in the information: Full Name (required), Email (required), Phone Number, Address, Country, Notes.
- Click "Save" to add the contact to the list.
✅ Expected result : New contacts appear at the top of the list.
💡 Tip: The more detailed your input, the easier it will be to search and analyze later.
4. Import data from CSV
Use this when you already have a customer data file (from Excel, a legacy system, etc.).
- Prepare a properly formatted CSV file with the following columns: email (required), firstName , lastName , phone , address .
- Click the "Import Data" button on the toolbar.
- Click "Select file" and choose the prepared CSV file.
- Review the data and click "Import" to complete the process.
✅ Expected outcome : Valid rows are added to the list; the system reports the number of successfully entered rows.
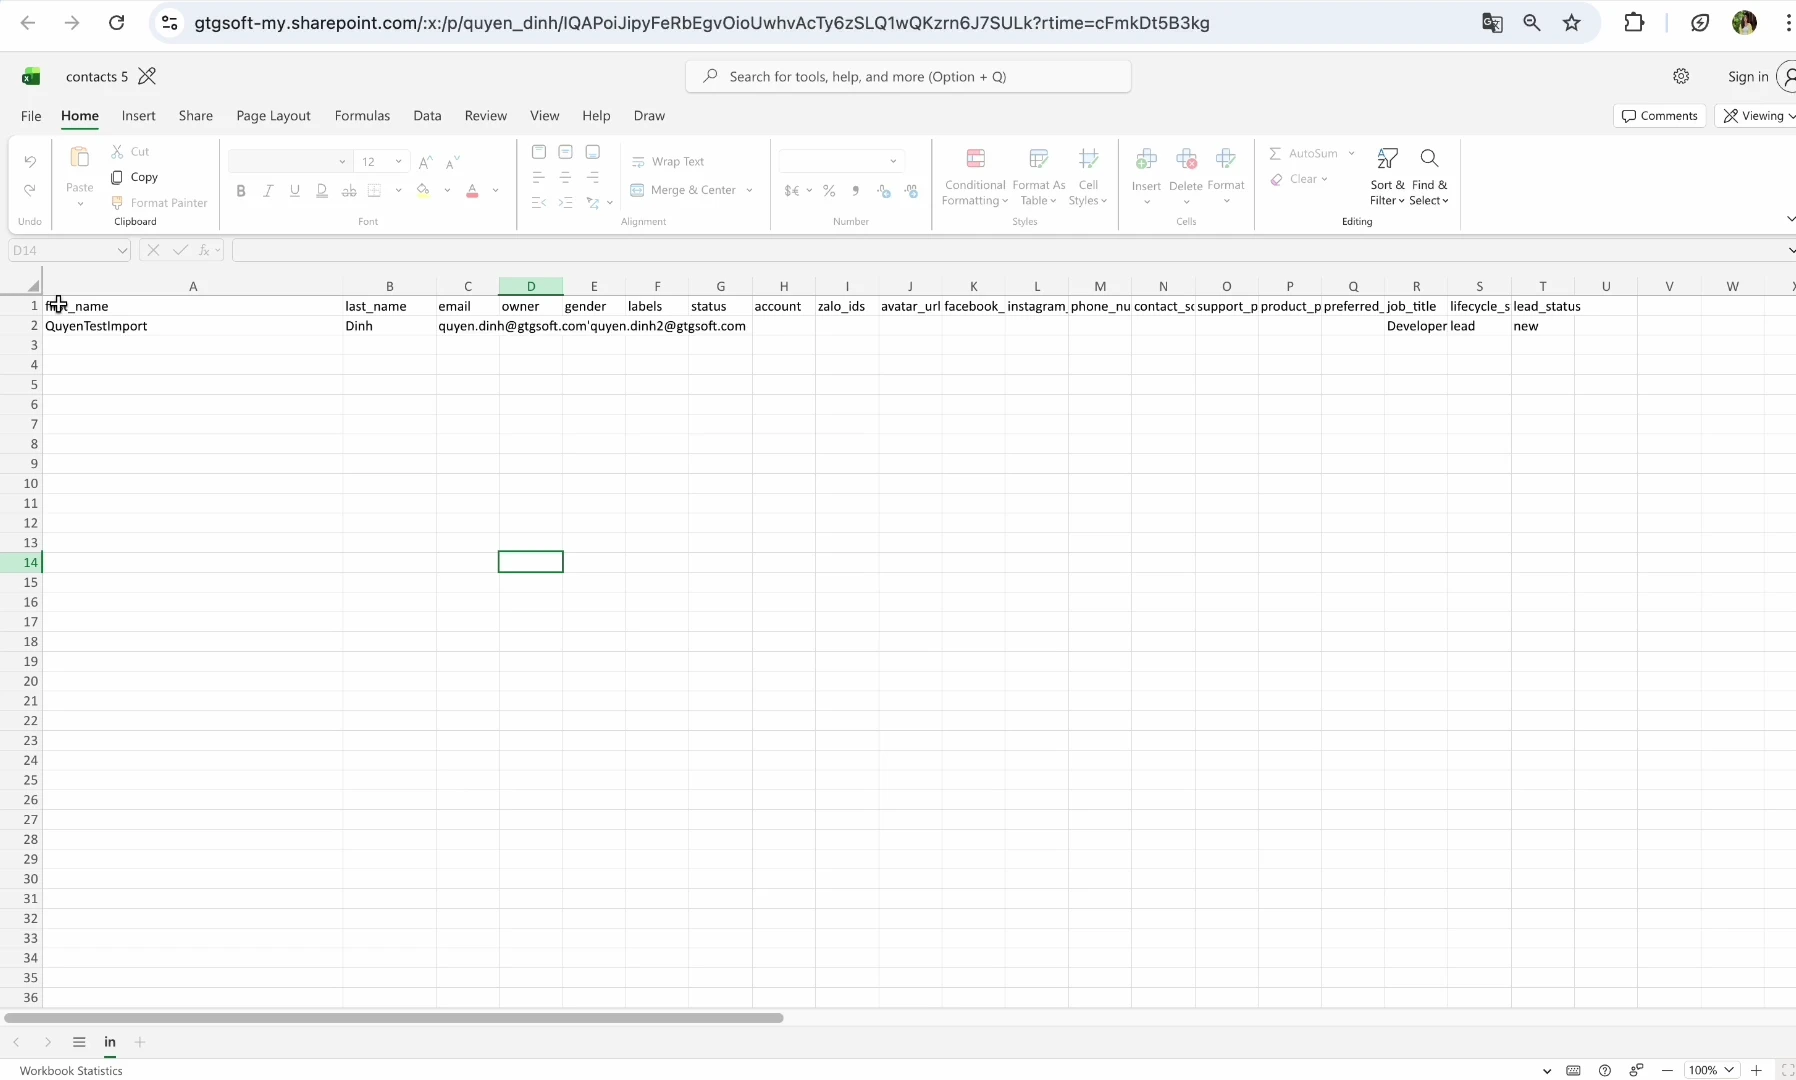
ℹ️ The email column is required — used for identification and to avoid duplication.
5. Customize the Display Columns
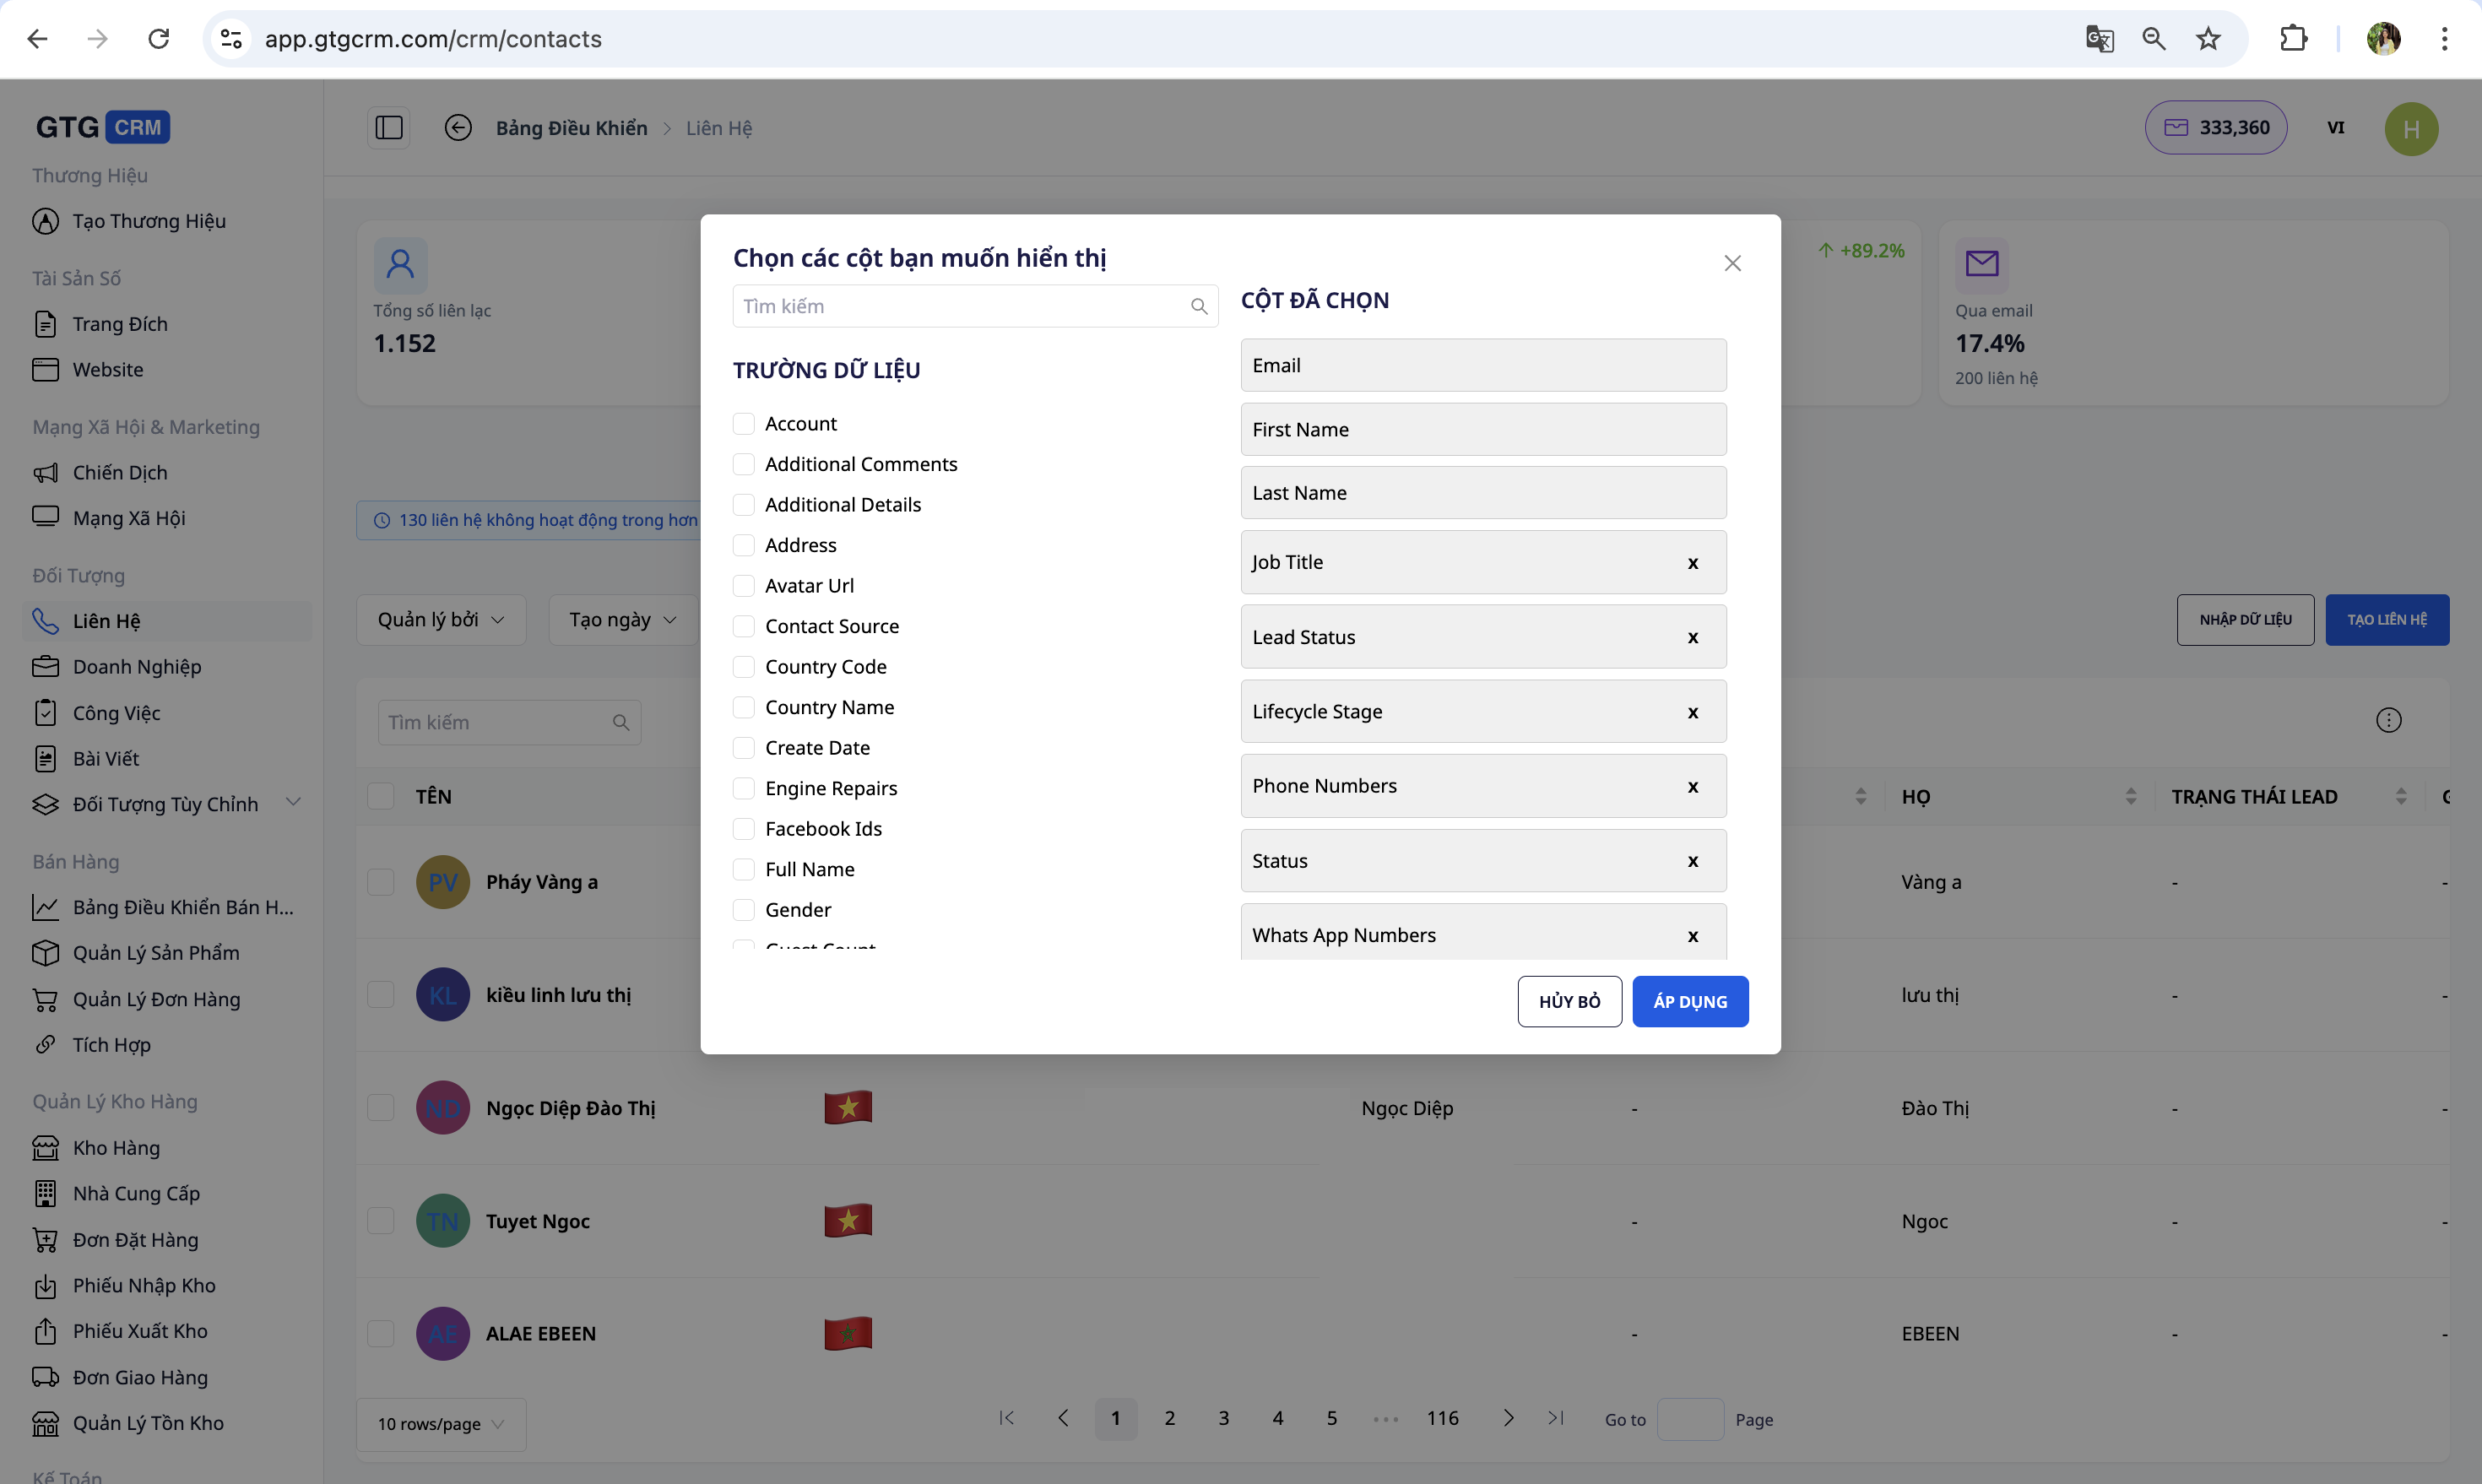
- Click "Edit column" on the toolbar.
- Check the boxes next to the columns you want to display, and uncheck the boxes next to the columns you don't need.
- Click "Save" to apply.
✅ Expected result : The list displays the correct columns you selected.
6. Use Filters
- Filter by date : Today · Yesterday · Last 7 days · This month · Custom.
- Filter by status : New · In Progress · Converted · Lost.
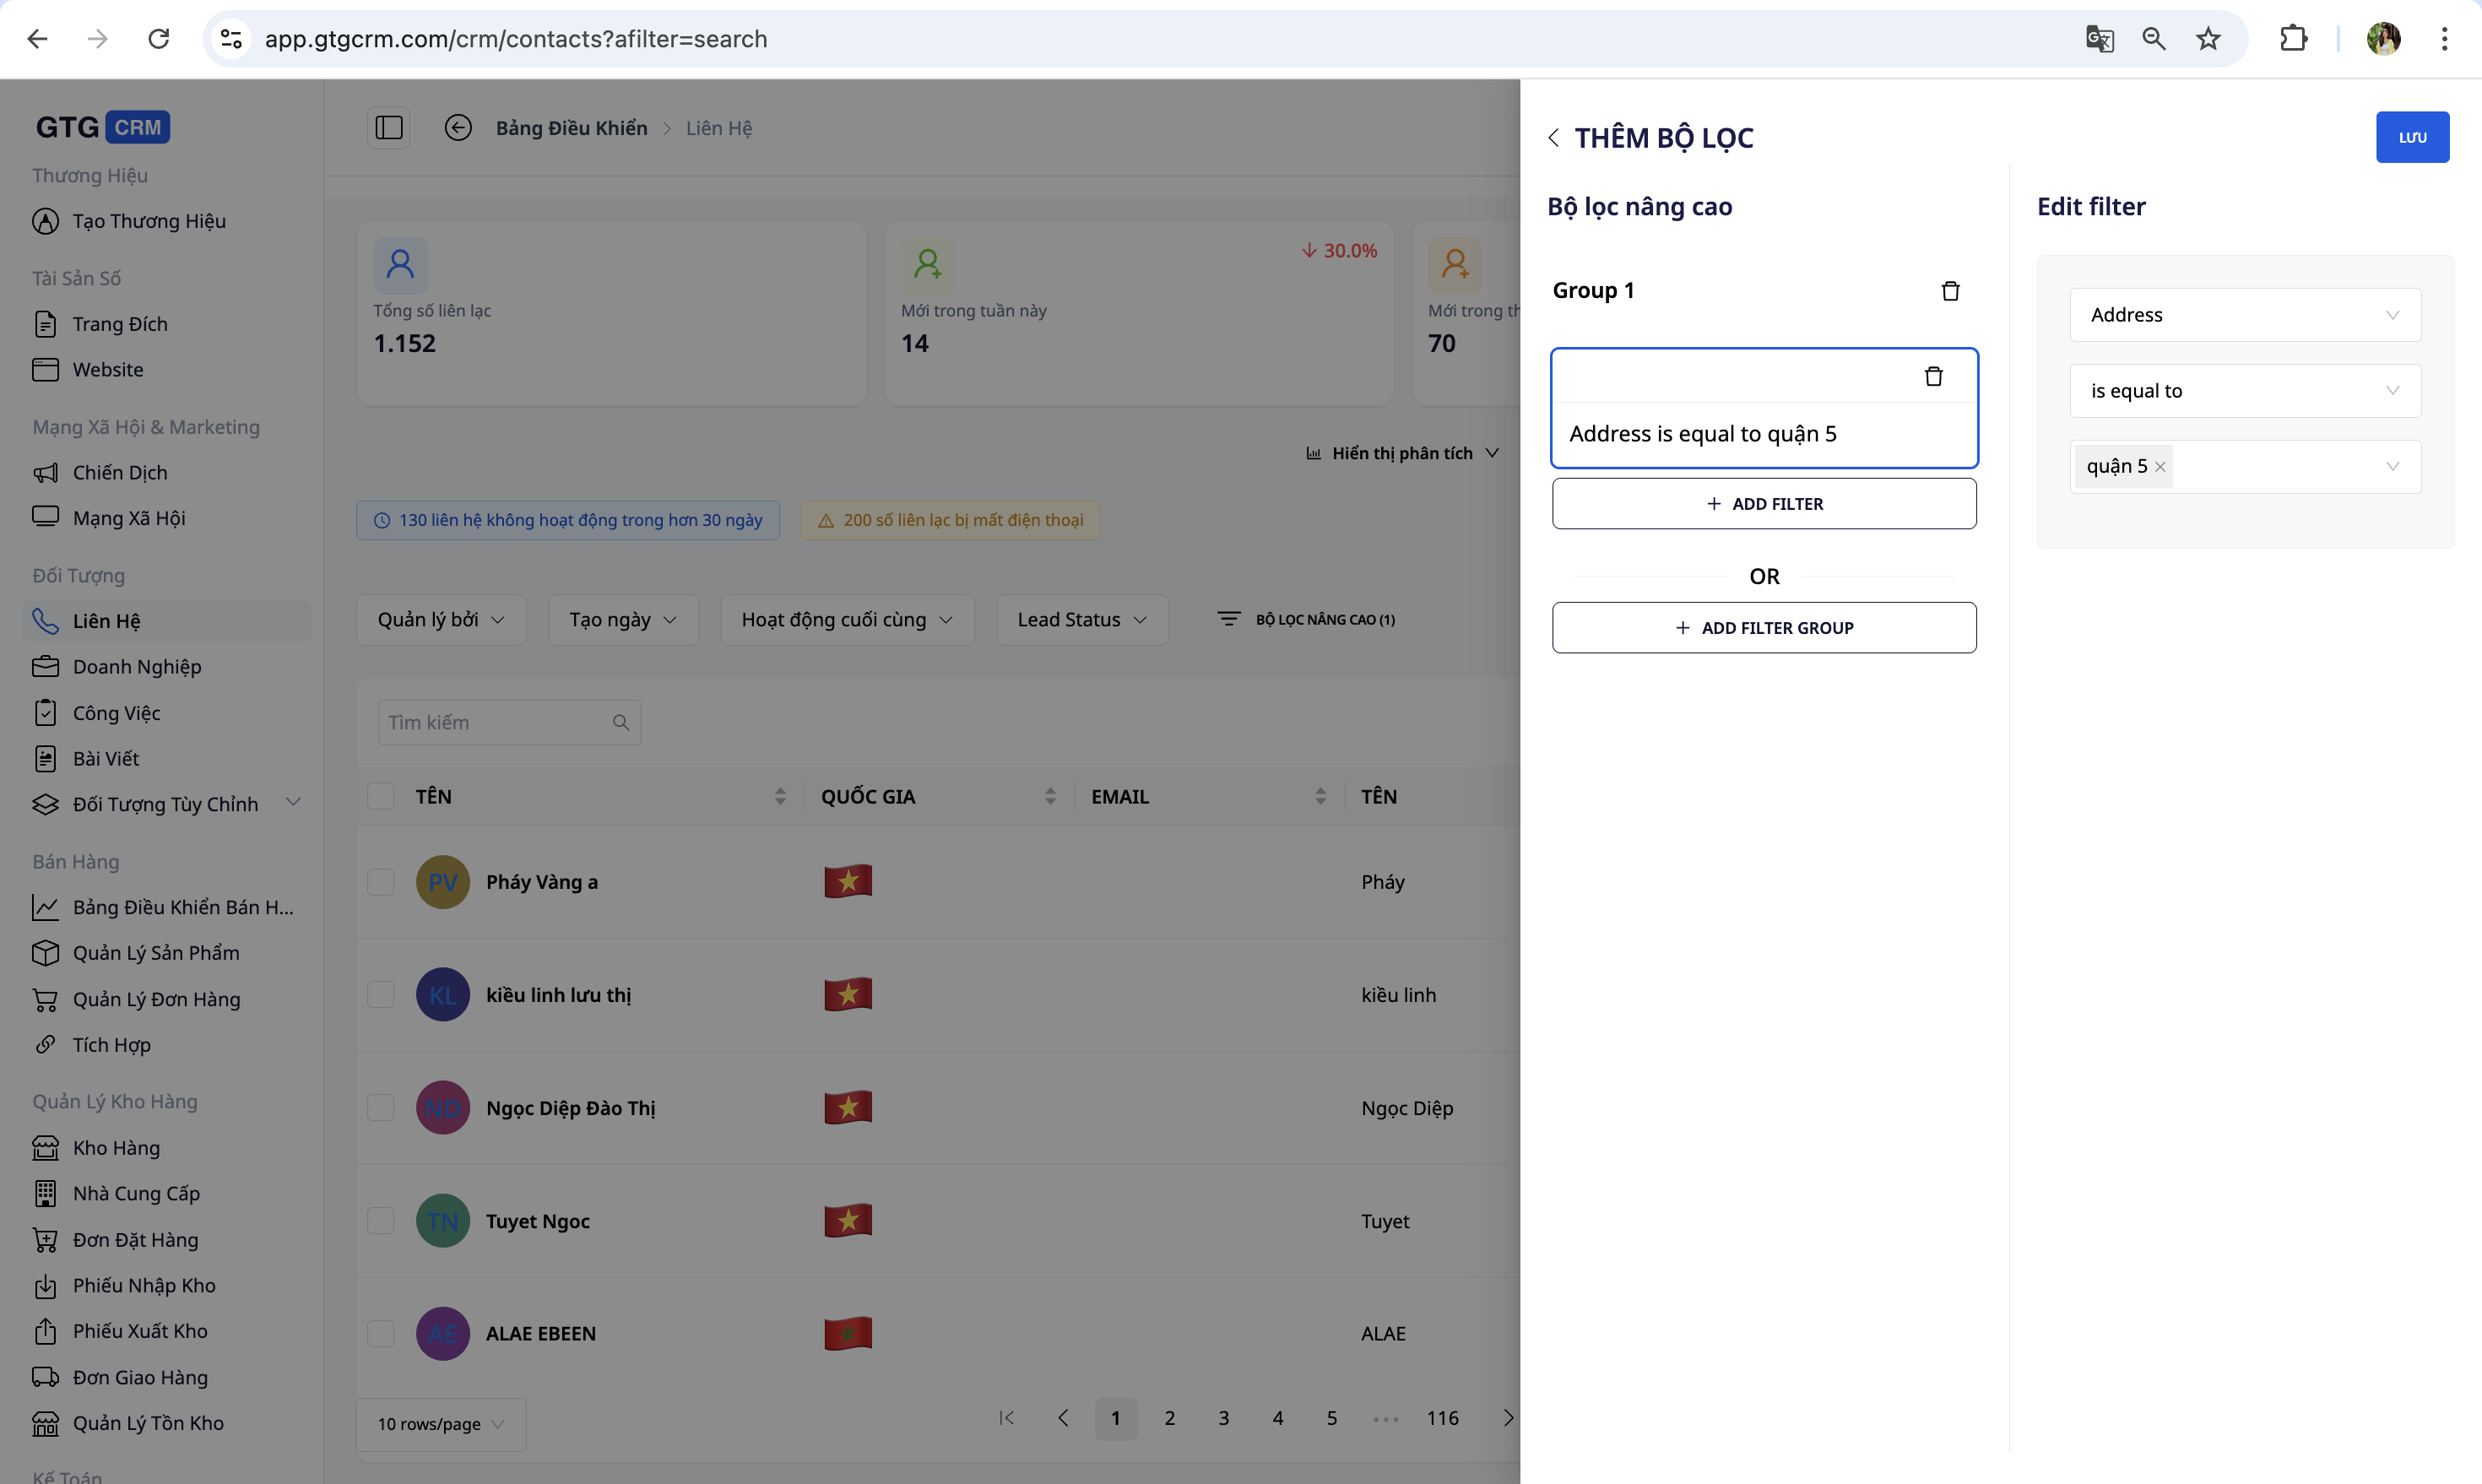
- Advanced filter : select the field (Address, Product, Source…) → enter the value. Example: Address = "District 5".
- Combine multiple conditions : for example, Address = "District 5" AND Product purchased = "Shirt".
✅ Expected result : The list should only contain contacts that fully match the selected criteria.
7. Edit Contact
Click on the contact's name to open the details page, where you can edit personal information, address, phone number, notes, and status.
✅ Expected result : Changes are saved and displayed directly on the details page.
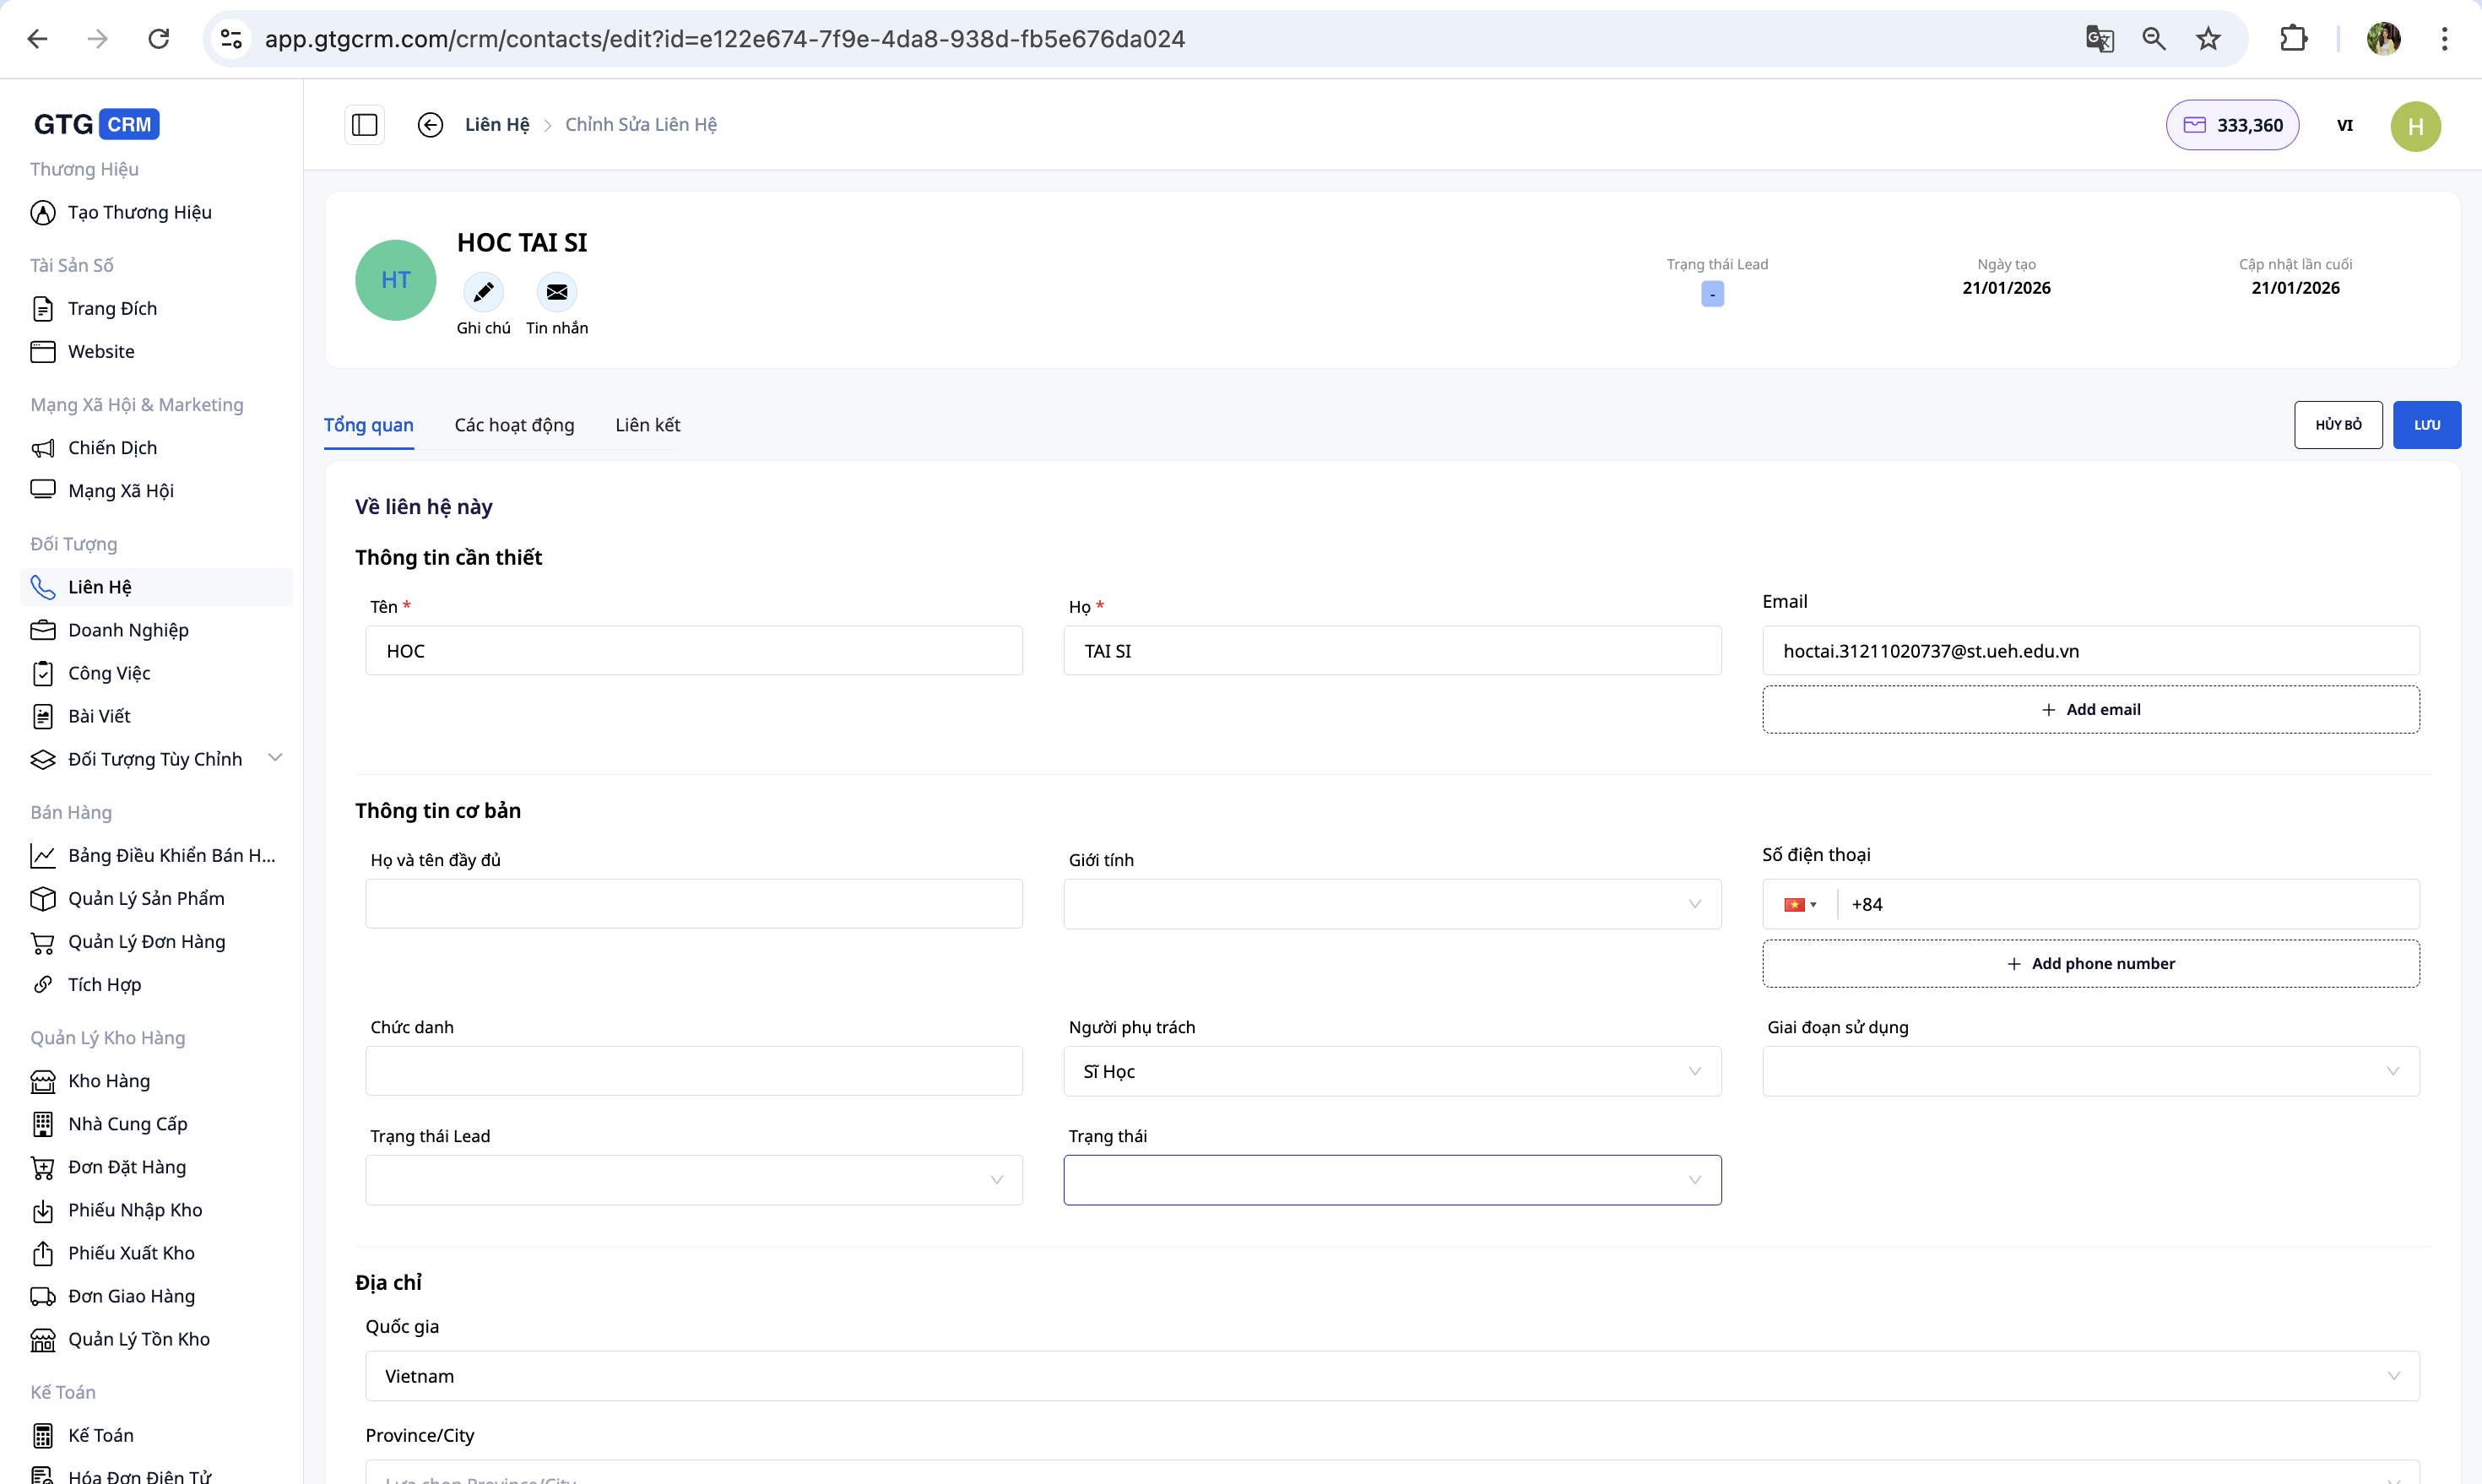
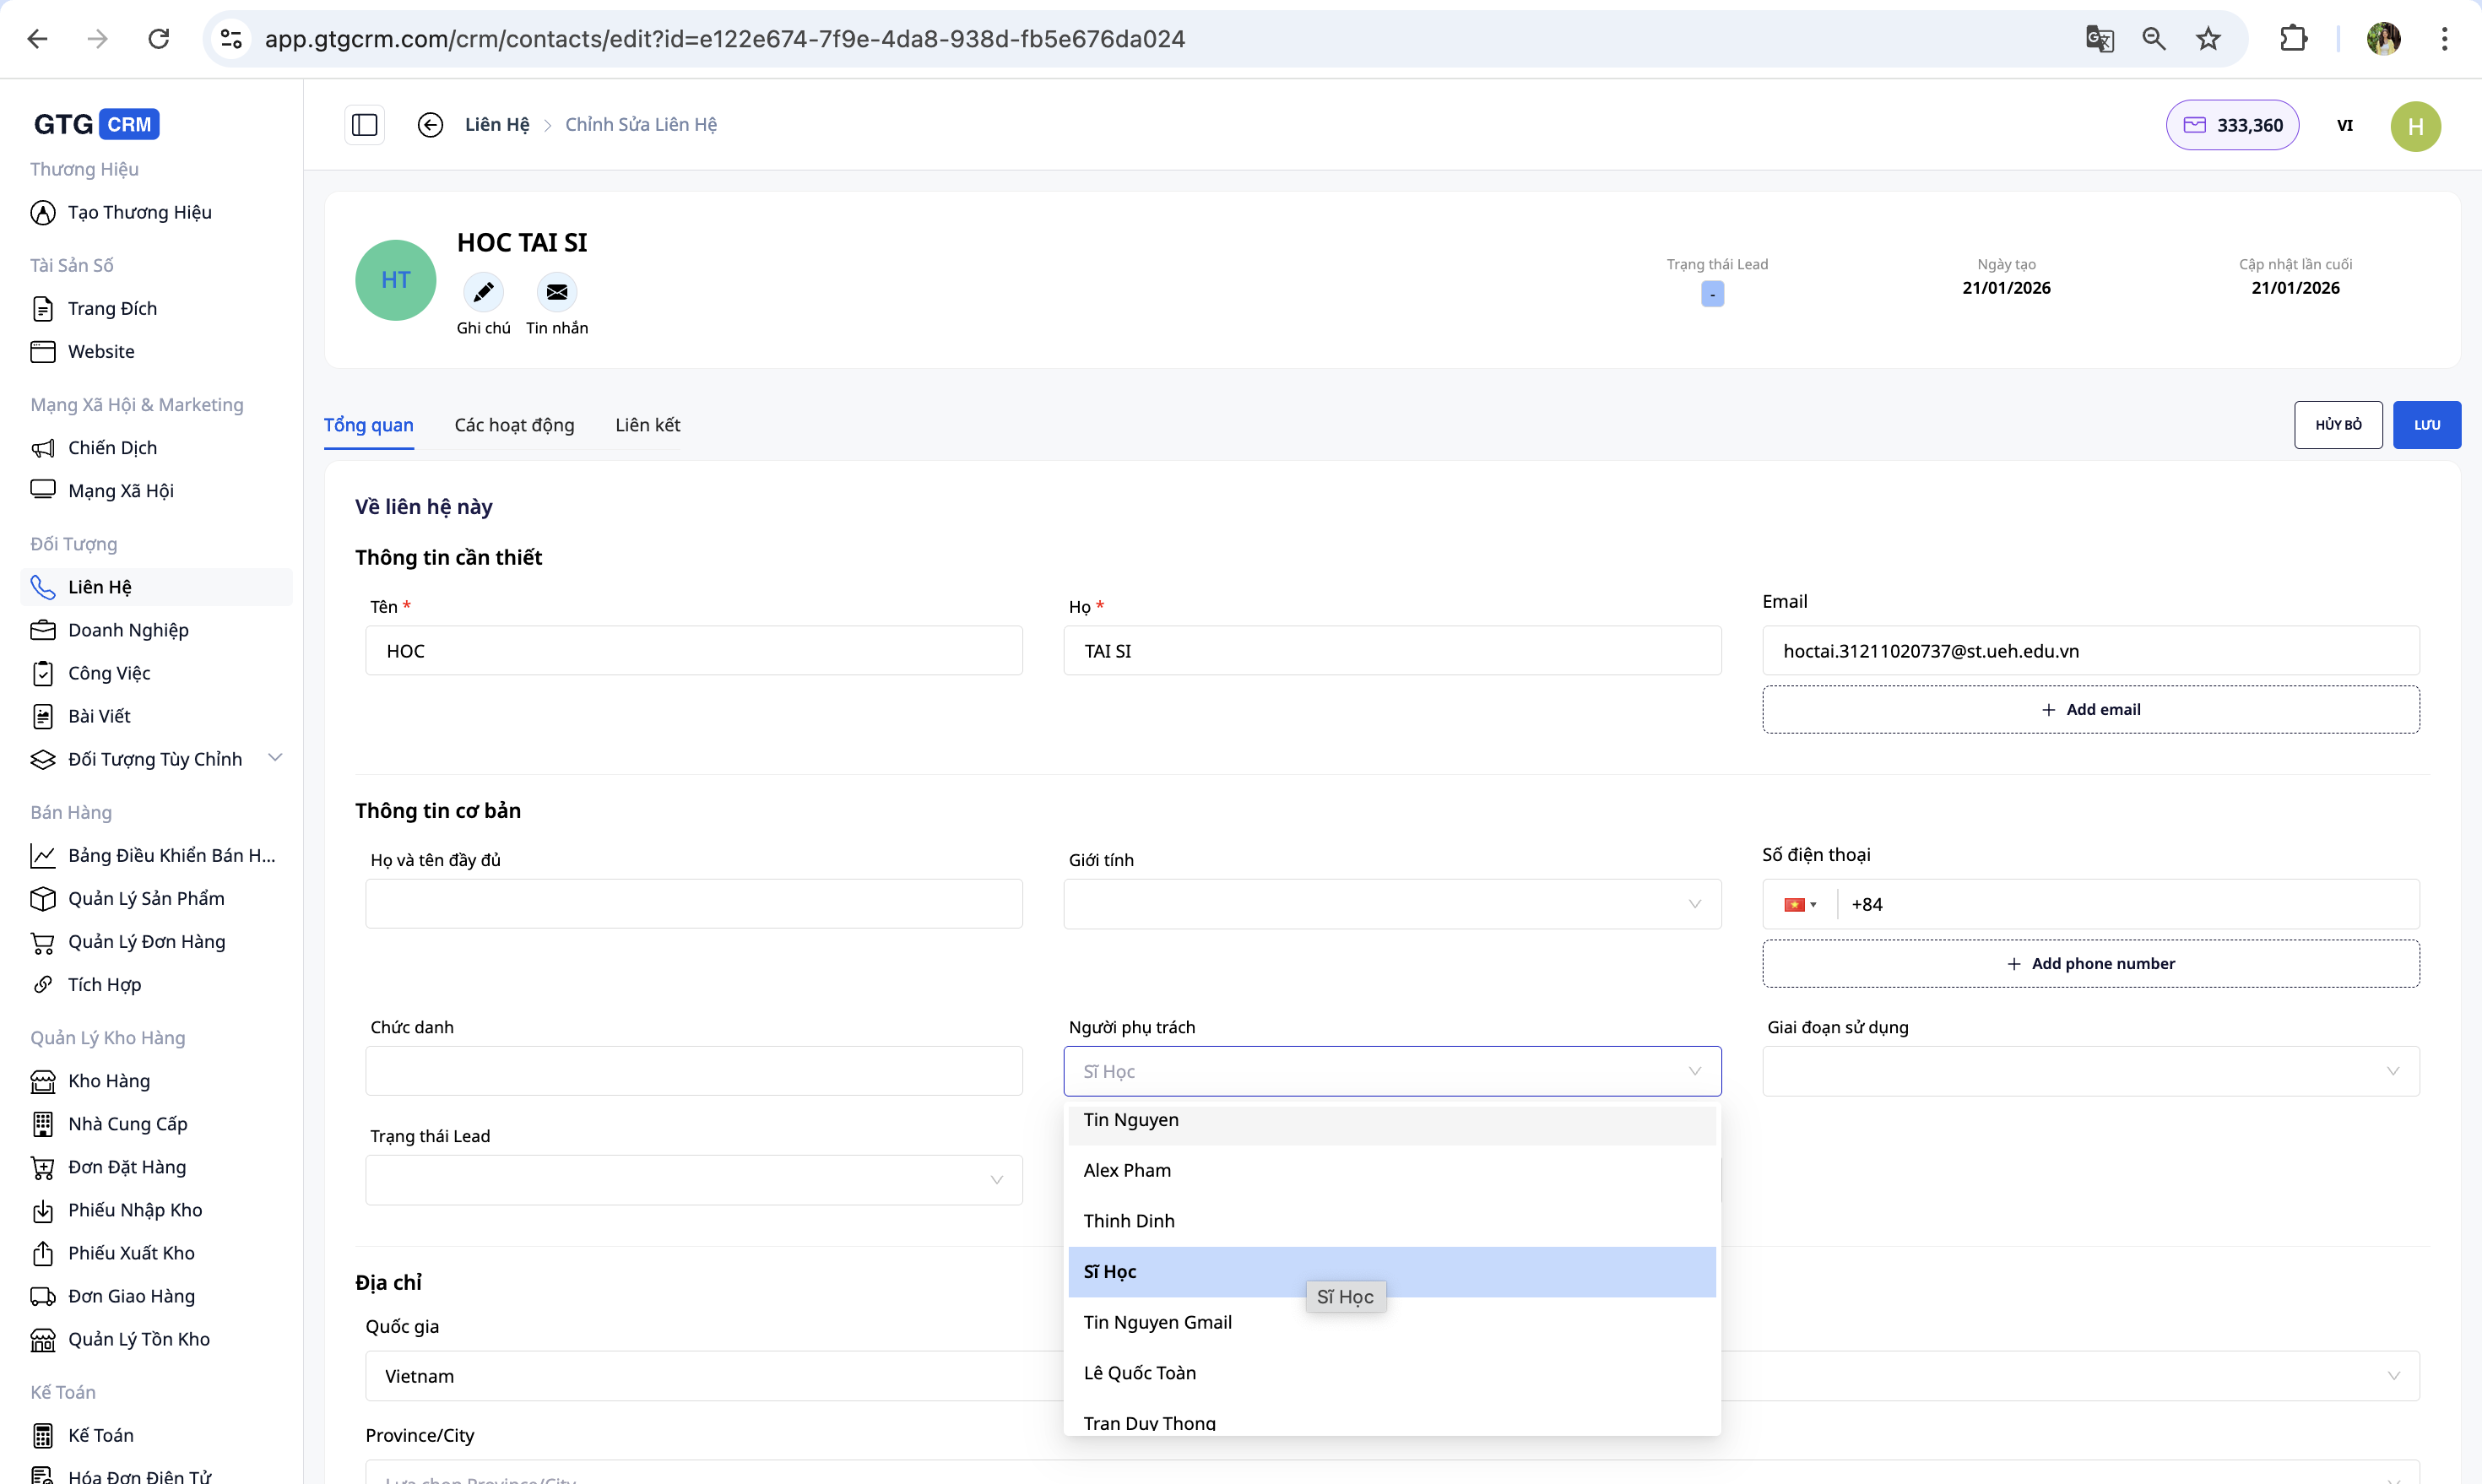
8. Assigning Responsible Persons
- Open the contact details for the assignment.
- In the "Person in Charge" section, click to select an employee.
- To transfer to someone else: click the name of the current person in charge → select the new person → save.
✅ Expected results : The new contact person's name will appear in the contacts; the "By contact person" data in the Analytics tab will be updated accordingly.
9. Contact Analytics Tab
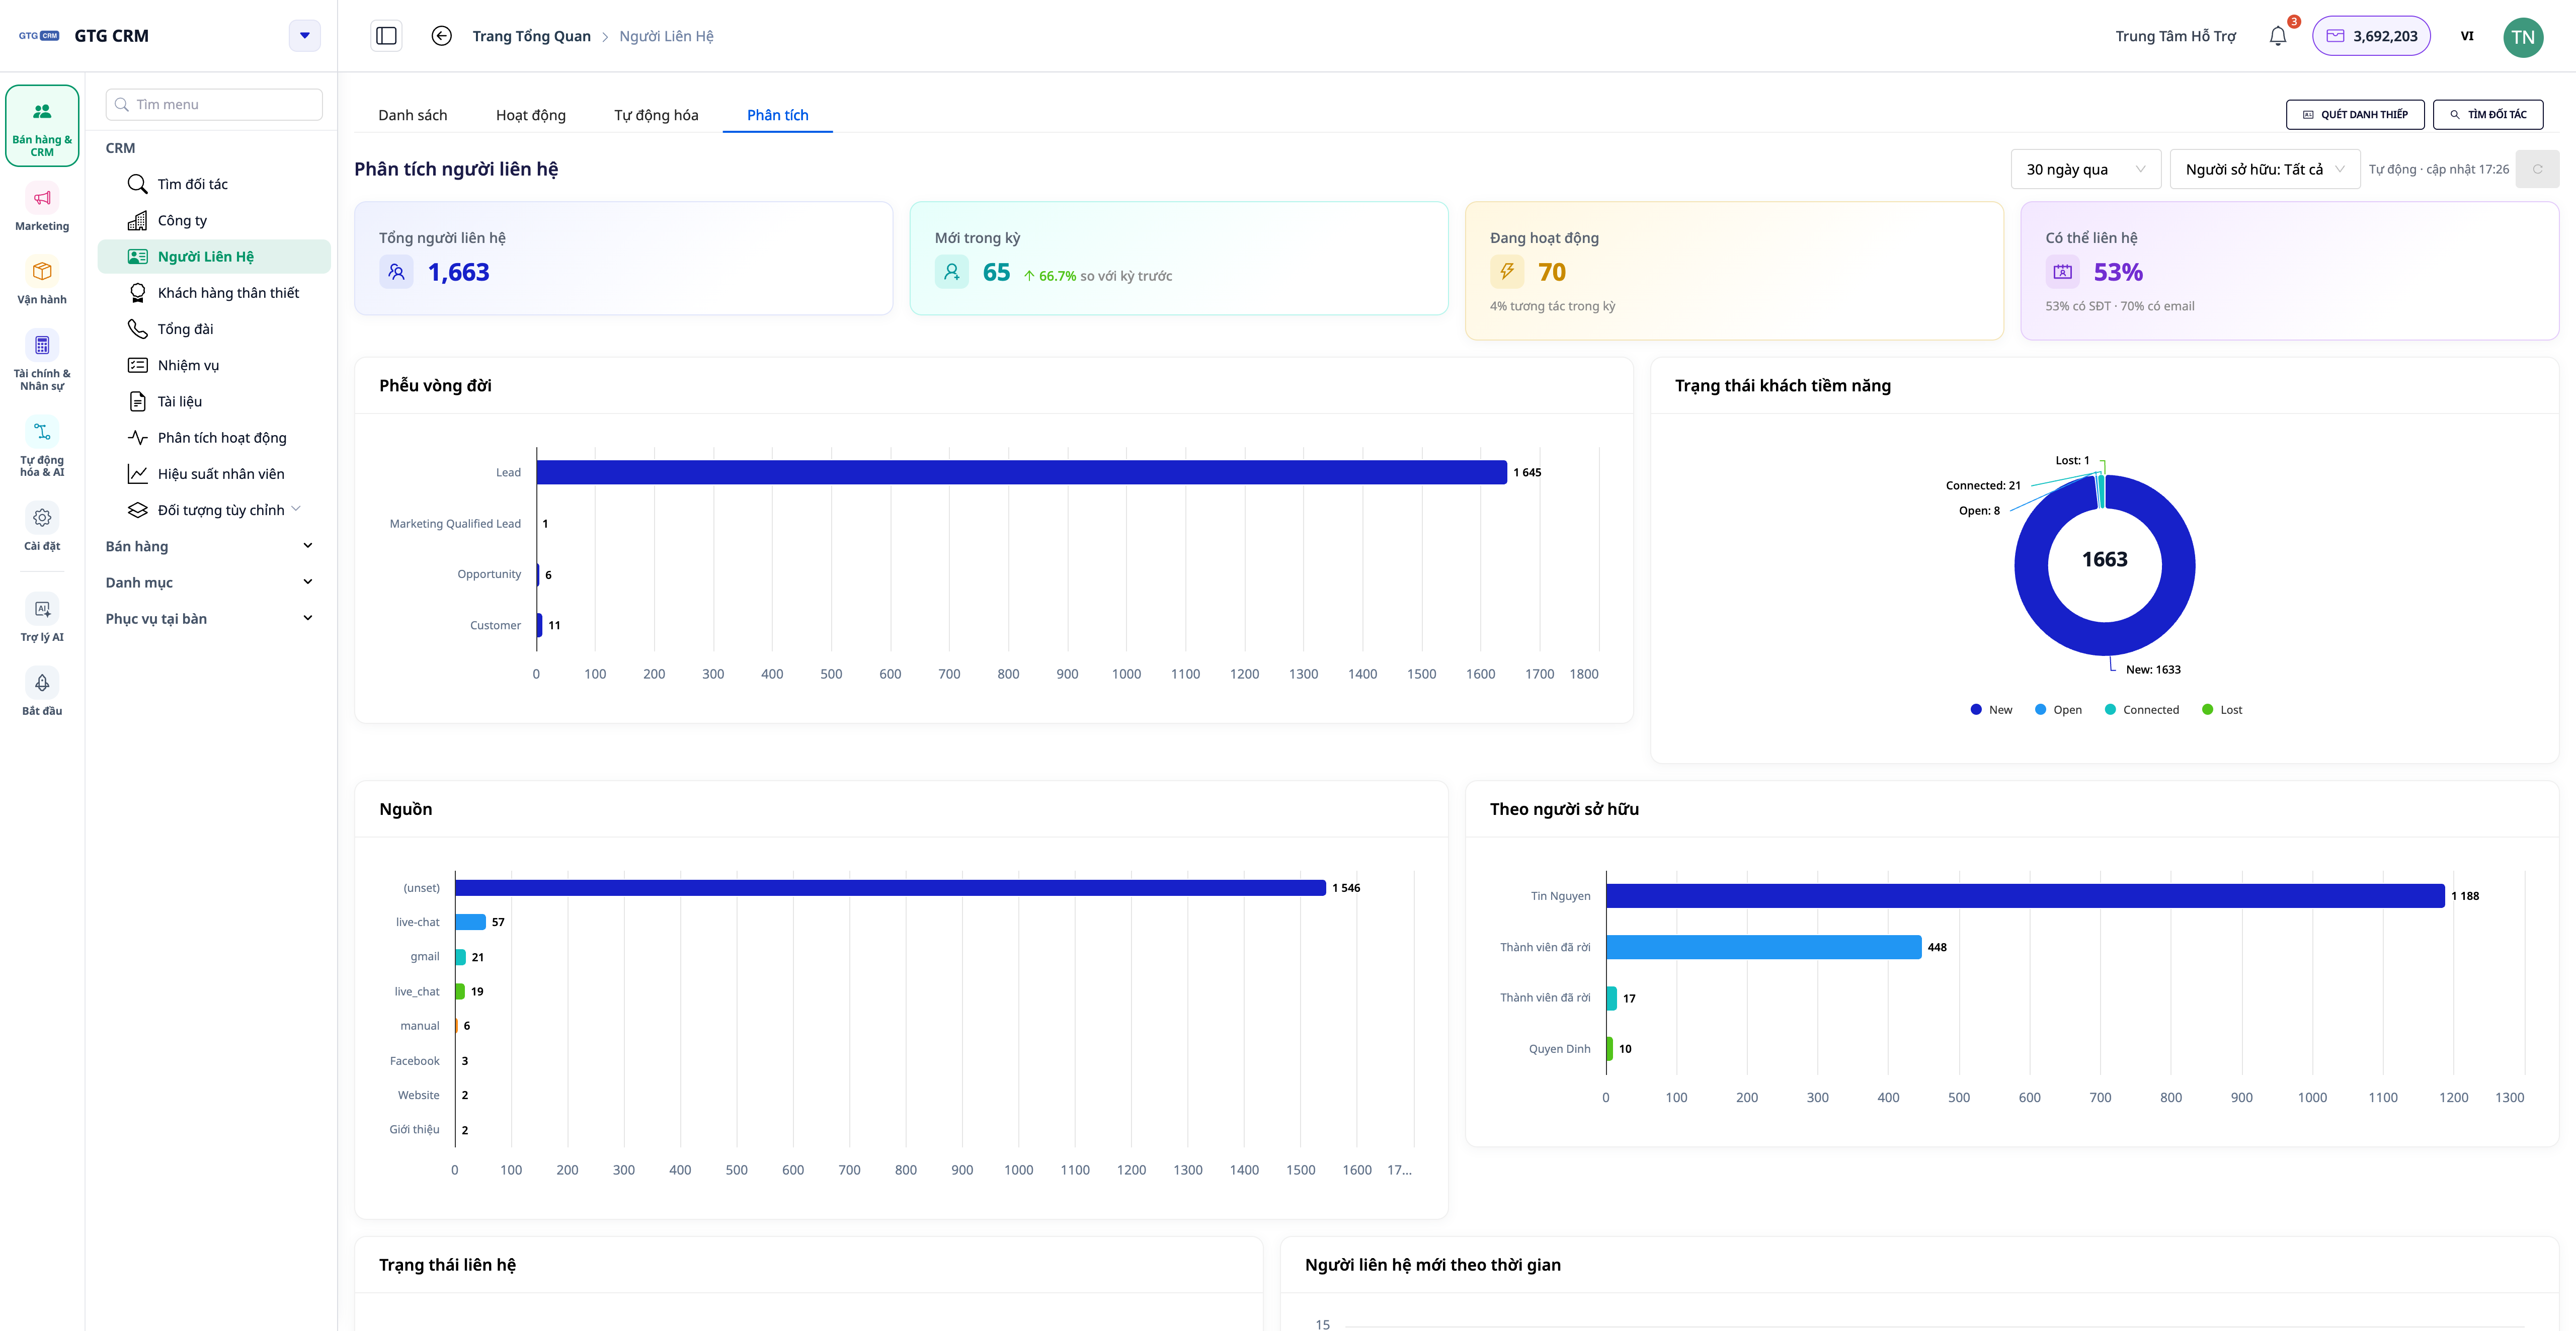
Right in the Contacts menu is the Analytics tab — a dashboard that calculates data across your entire contact list (no template limit), updated in real time. No need to export to Excel.
- Open Contacts and select the Analytics tab.
- Read the KPI card at the top of the page: Total contacts · New contacts during the period (with trend ▲/▼ compared to the previous period) · Active contacts · Contactability rate .
- View the charts: Lifecycle funnel , Lead status , distribution by Source ("Source"), by contact person , New contacts over time , and Data health table (percentage of email/phone number/contact person/company).
- Change the time range (e.g., "Last 30 Days" → "This Month") or filter by Owner at the top of the page — all metrics and charts are recalculated accurately across all data.
✅ Expected results : The Analytics tab displays KPI tags, lifecycle funnels, and attribution charts; the "Total Contacts" number matches the actual total number of customers (not limited to 1,000). The right-hand corner displays the "Auto · Update HH:MM" indicator.
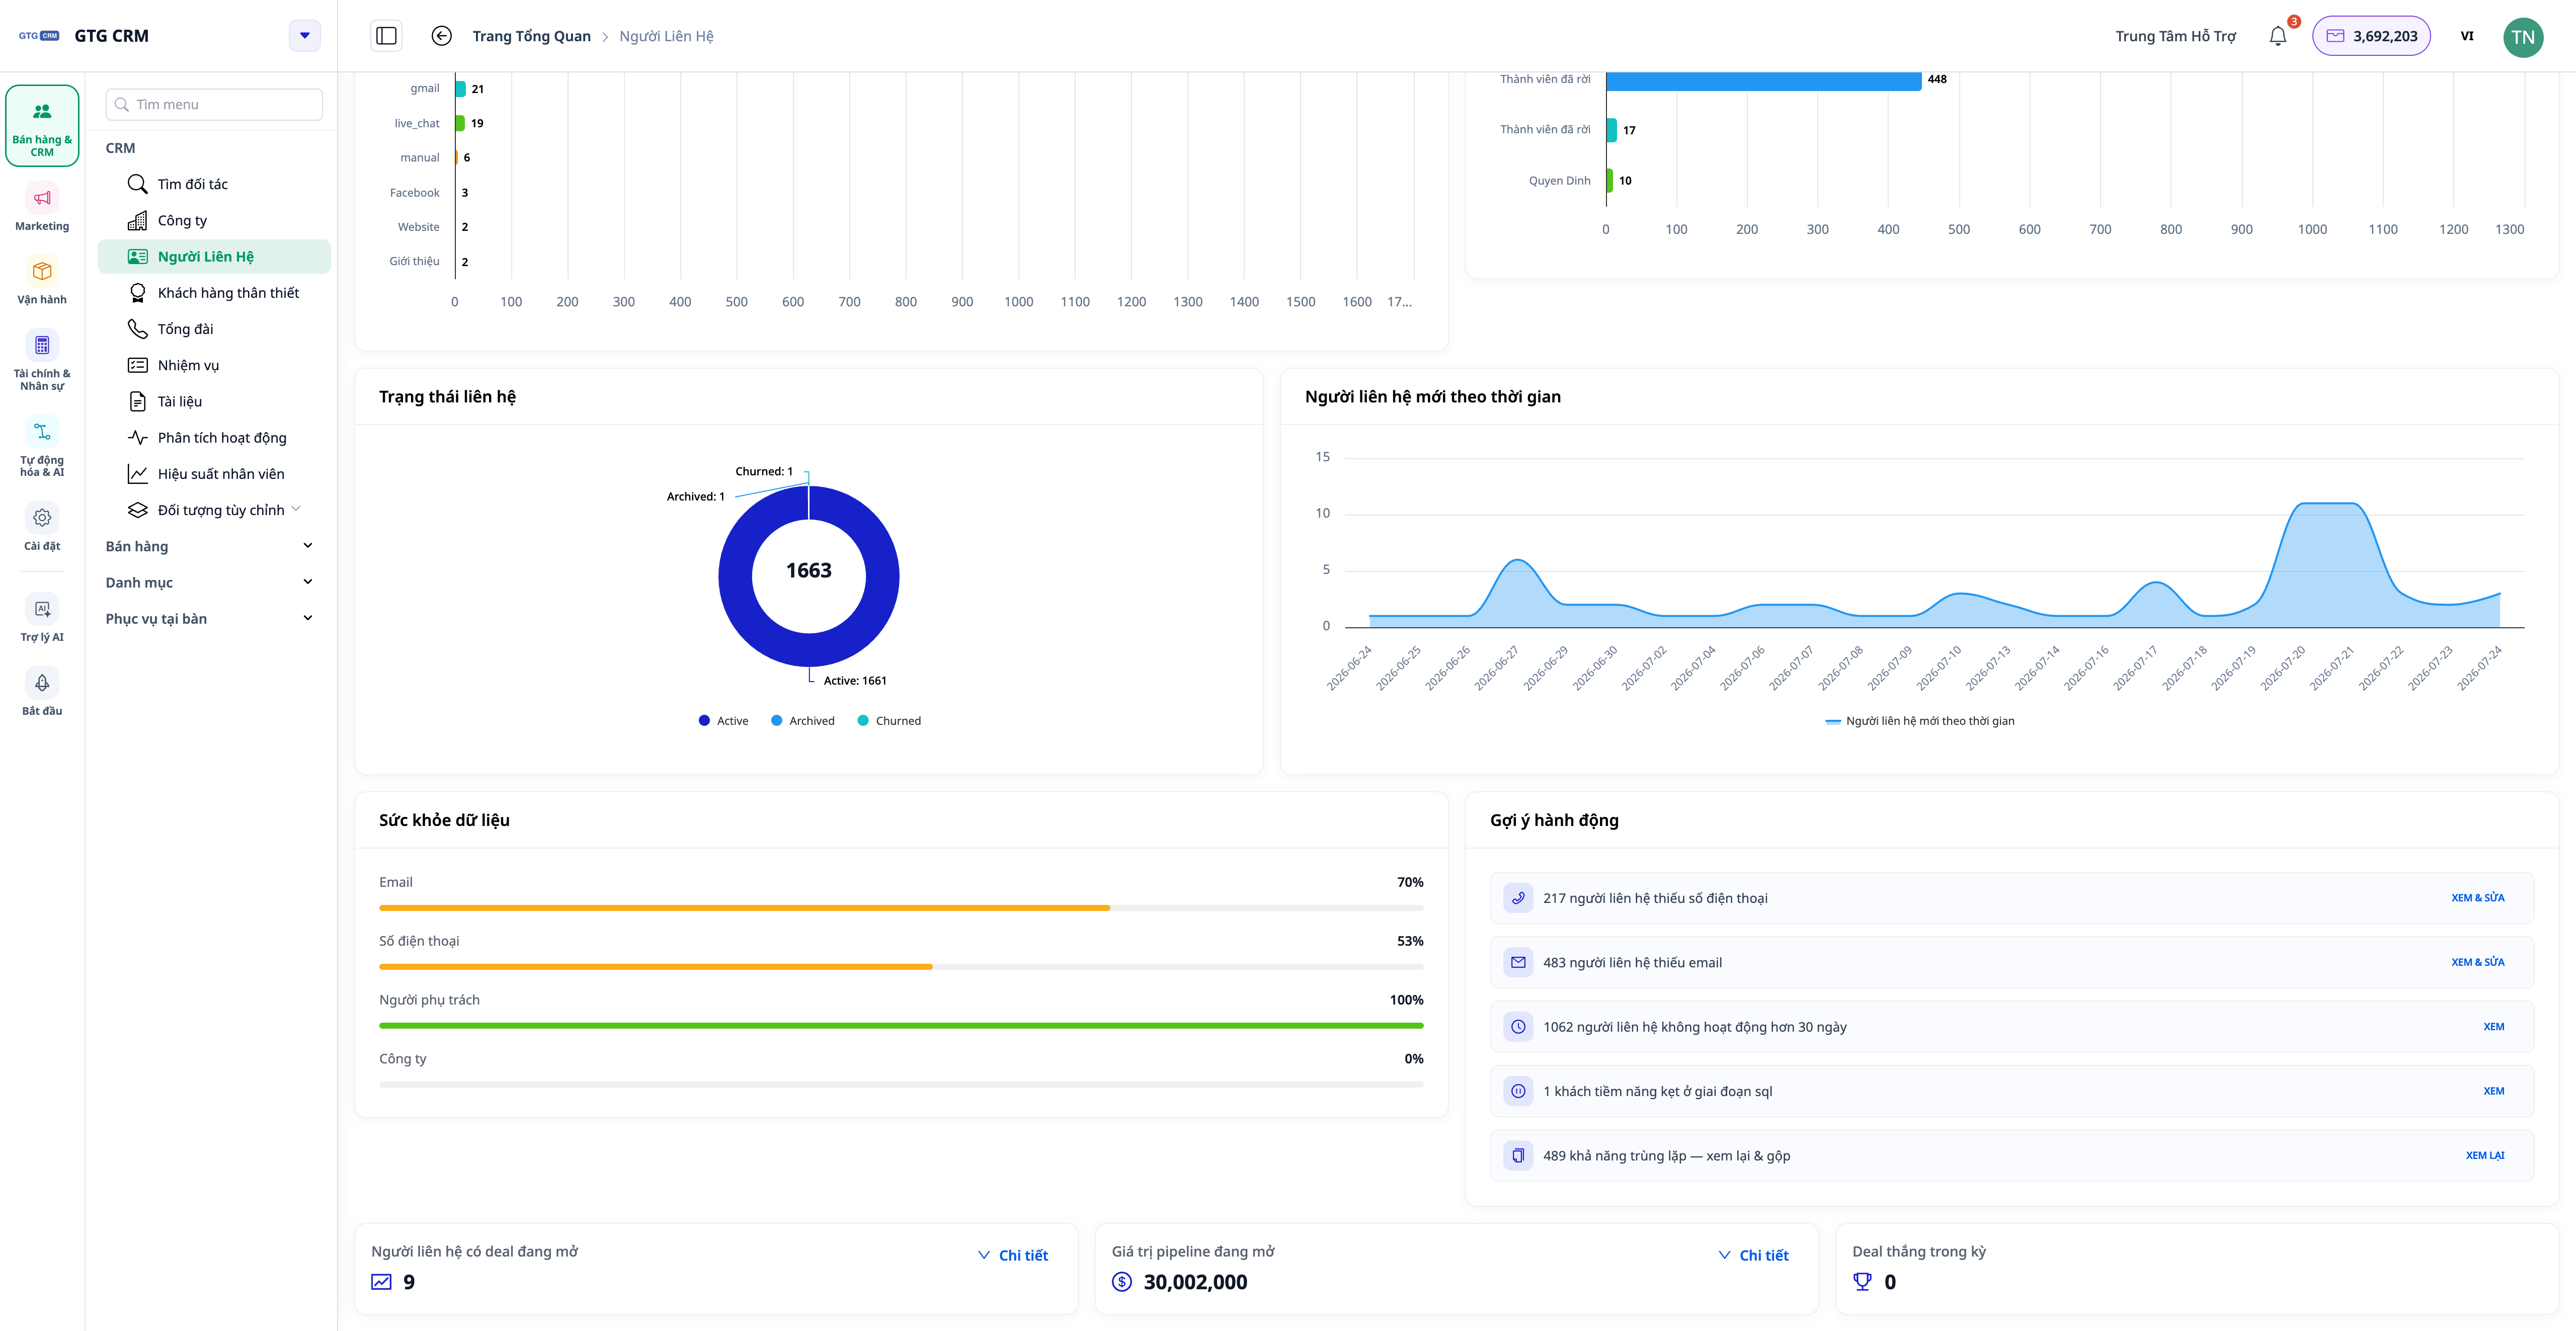
9.1 Suggestions
At the bottom of the dashboard is the Action Suggestions table: each line contains a finding + quantity + a button that leads directly to a pre-filtered list of that specific customer group.
- See the suggestions, for example: "...contact missing phone number" , "...inactive > 30 days" , "...no one in charge yet" , "...stuck at a stage of the lifecycle" .
- Click the button next to a suggestion (e.g., "View & Edit" ).
- You're taken back to the pre-filtered list tab with the right customer group — ready to add, assign, or care for.
✅ Expected result : After clicking "Suggest," the List tab will only display the contact group specified in the suggestion (e.g., only customers without a phone number).
10. Company Analytics Tab
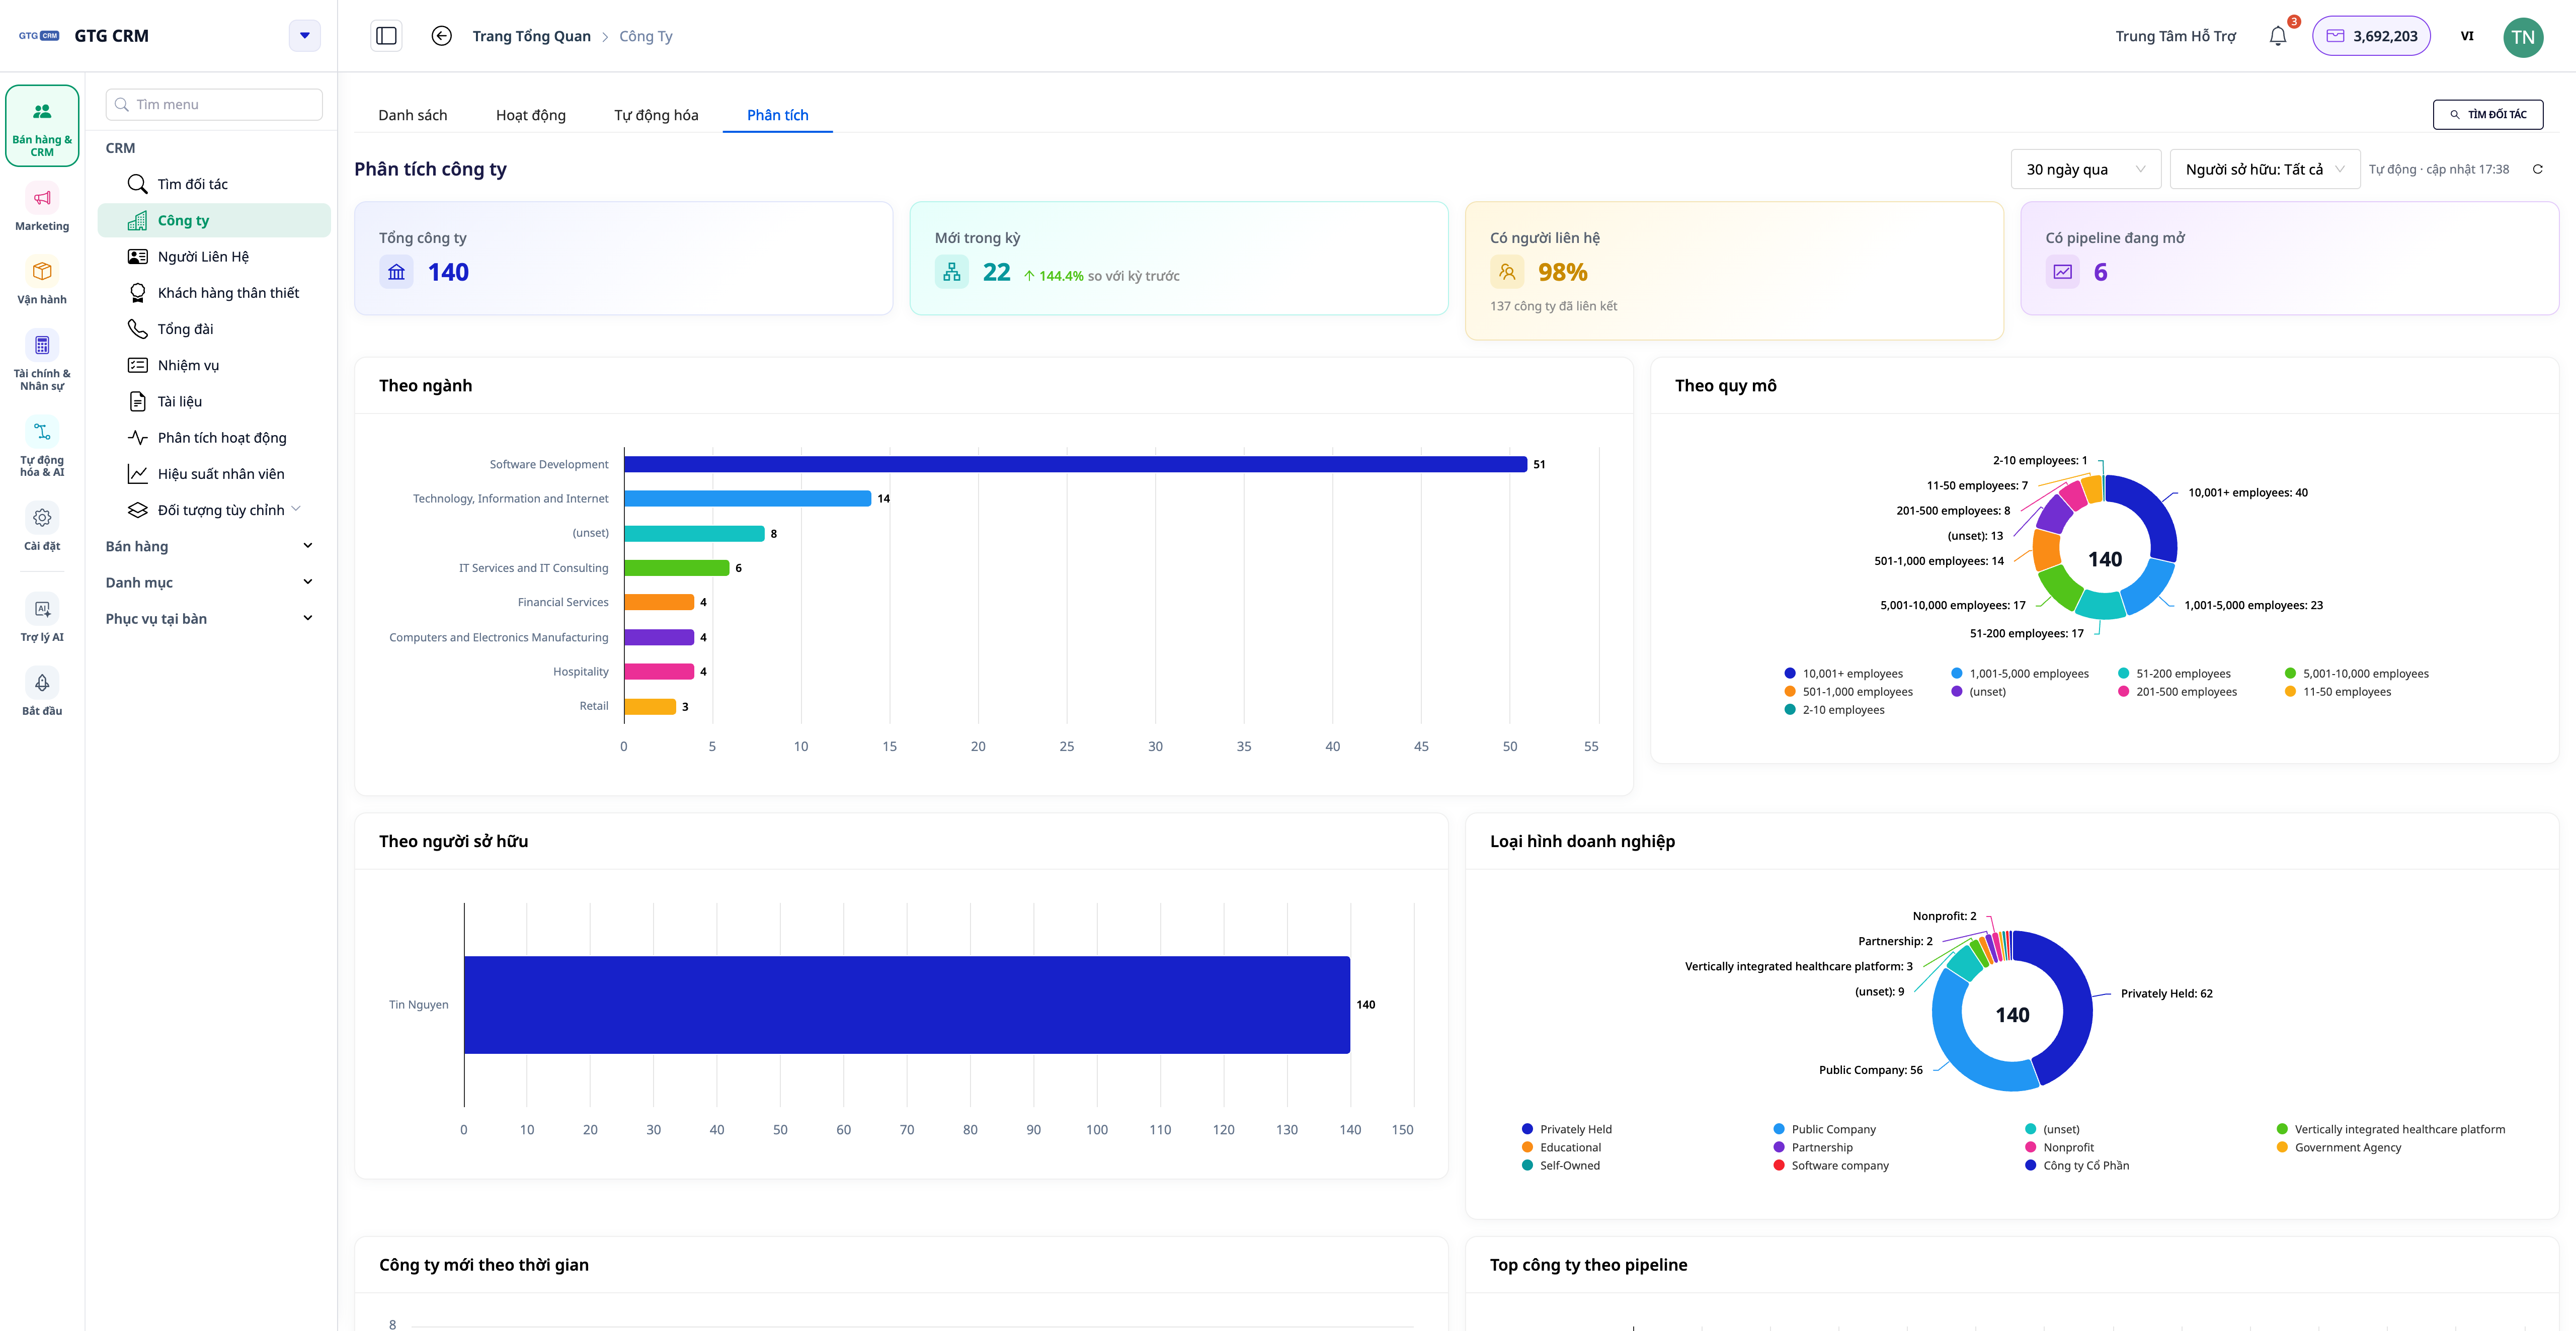
The Business menu also has a similar Analytics tab, focusing on the company's perspective.
- Open Business and select the Analytics tab.
- View KPI cards: Corporation · New in the period · Related companies (%) · Companies with open pipelines .
- View the charts: By industry , By size , By person in charge , New companies over time , Top companies by open pipeline , and Data health (percentage of domains/industries/person in charge/contacts attached).
- Use suggestions like: "... company has not linked a contact person" , "... missing domain/industry" , "... no person in charge yet" .
✅ Expected results : The Business Analysis tab displays charts by industry/size/pipeline; clicking on a suggestion opens the correct corresponding company group.
11. Activity 360 Tab
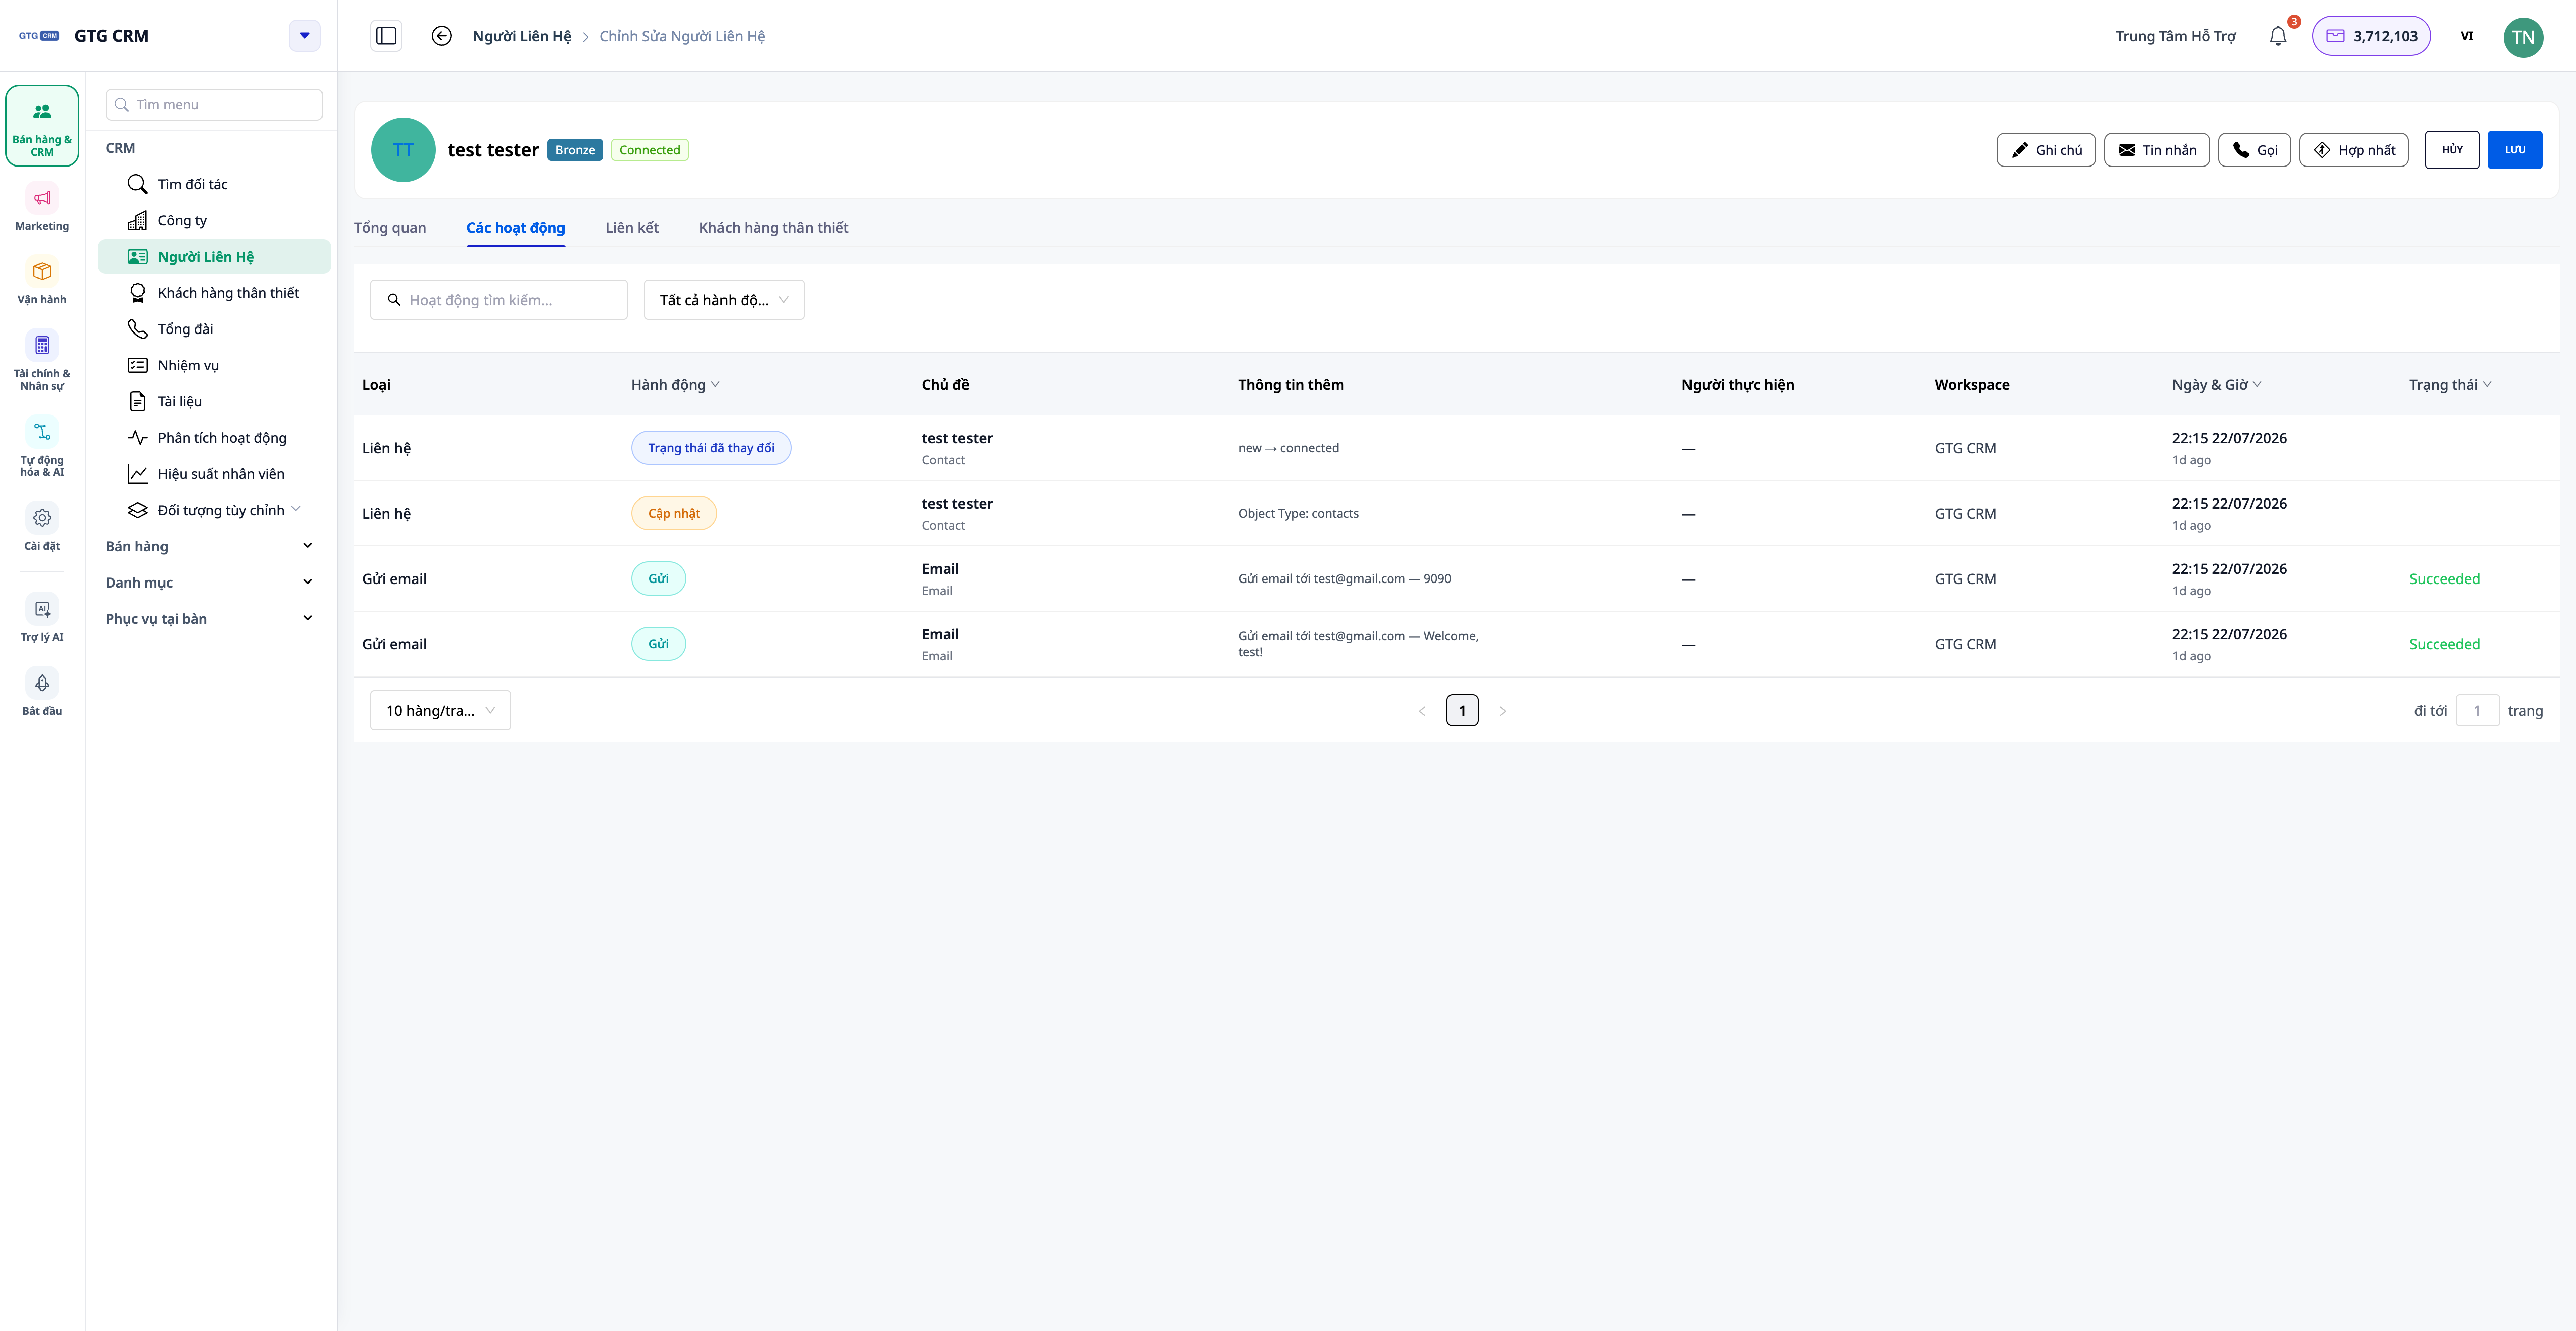
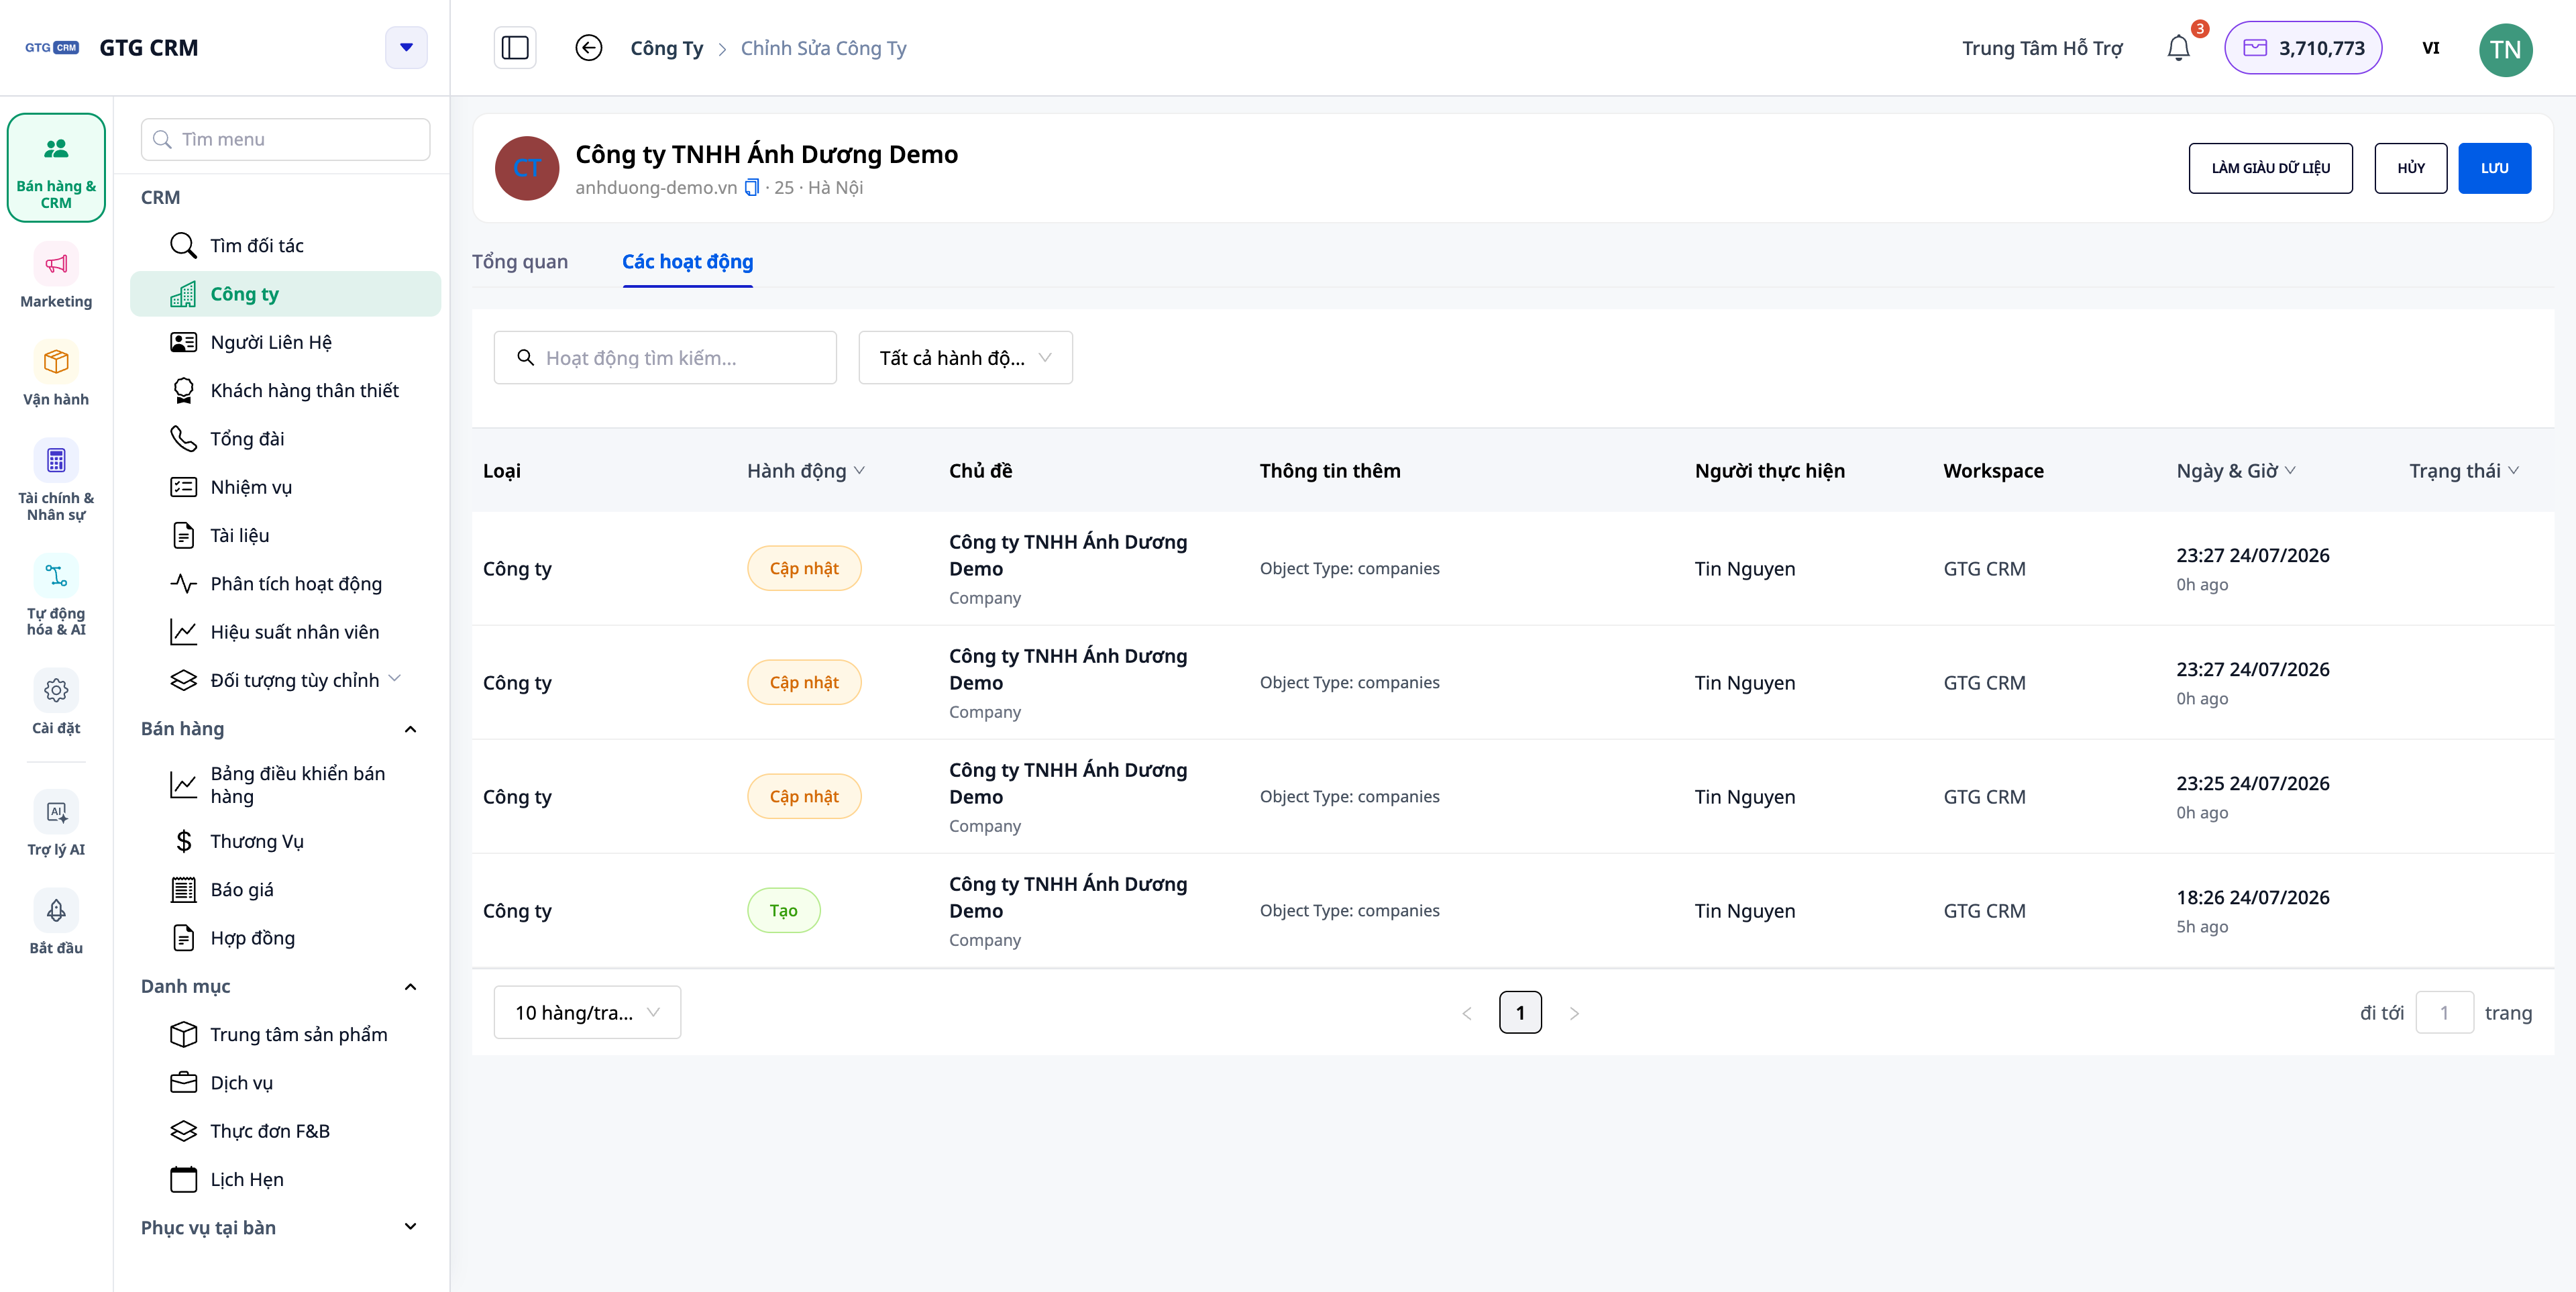
Each contact and company has an Activity tab that displays all relevant developments on an easy-to-read timeline .
- Open a contact , select the Activity tab.
- View the timeline: calls, emails, deals, orders… each entry clearly shows who performed the action (name, not identifier) and what action was taken , in your language.
- Open a company , select the Activities tab: the scrollable timeline aggregates the activities of contacts, deals, and orders belonging to that company.
✅ Expected results : The "Subject" column displays the customer/object name (not the code), the action column displays the correct Vietnamese text; the company timeline includes activities from all subordinate contacts.
11.1 Feed Operations at the List Level
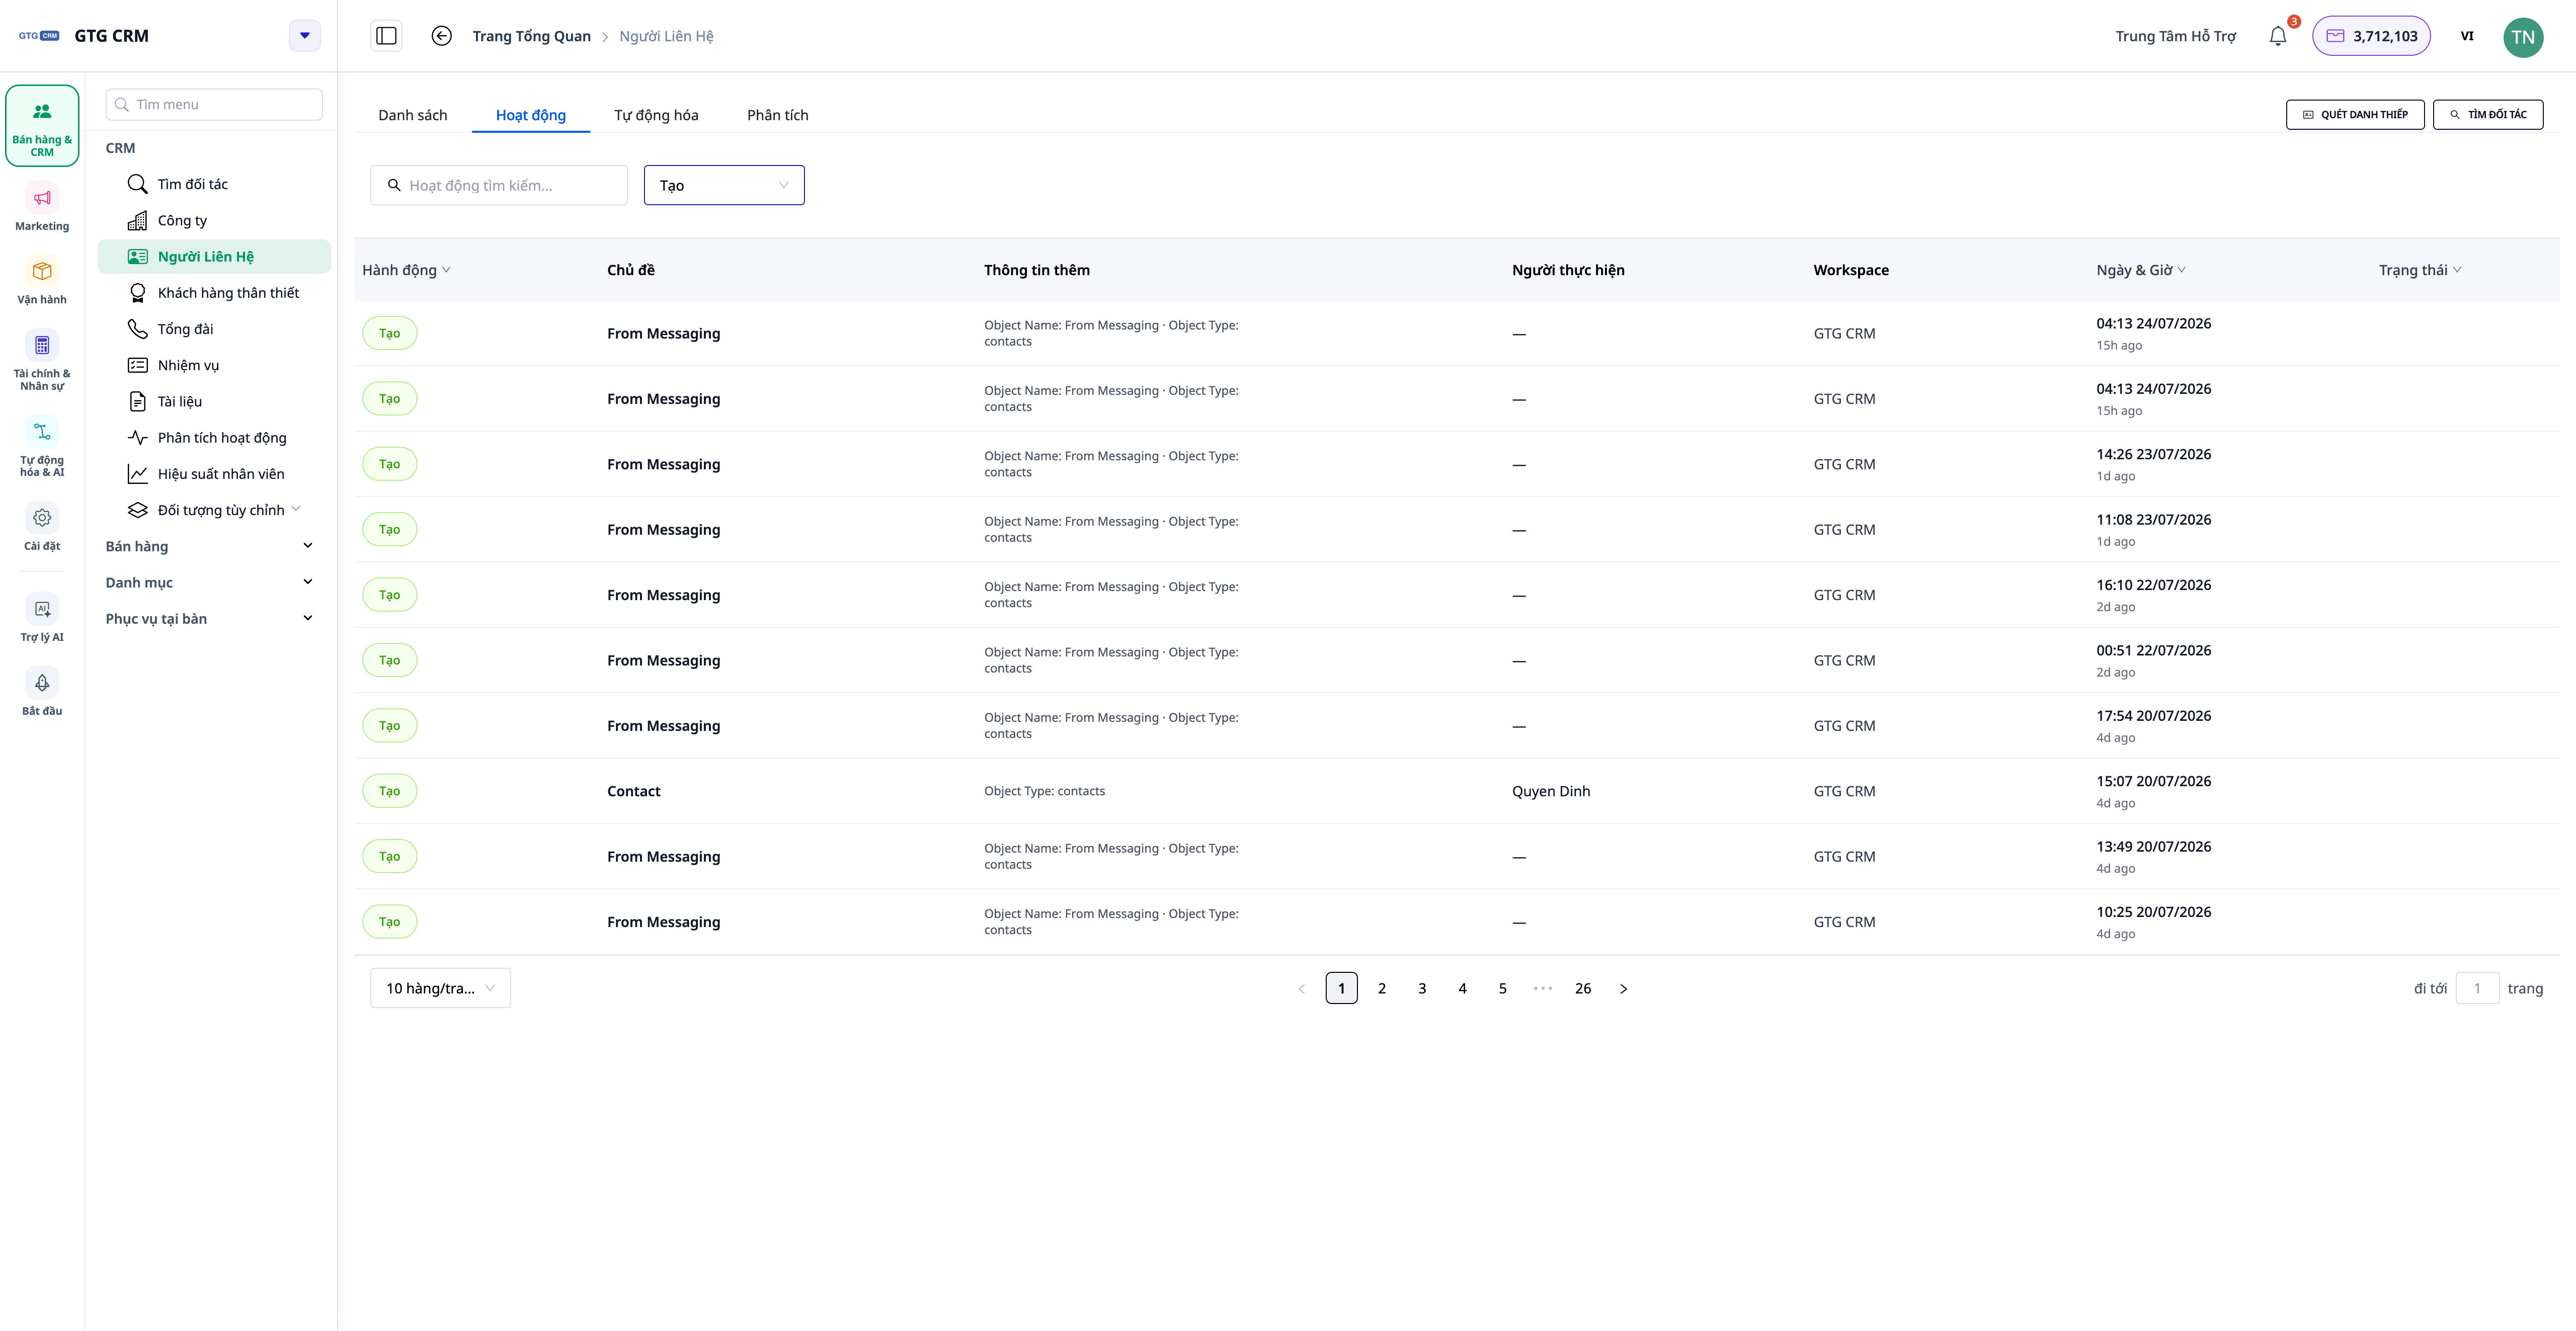
- In the Contact (or Business ) menu, select the Activities tab at the list level.
- View a general feed of all activity across all contacts/companies in the workspace.
- Filter by performer / action type / date range .
✅ Expected result : The feed displays the activity of all contacts in your workspace and can be filtered by person/type/date; the feed is limited to your workspace.
12. Overview of Operational Analysis
The Activity Analytics area provides an overview of the team's collaborative productivity.
- Go to CRM → Activity Analytics .
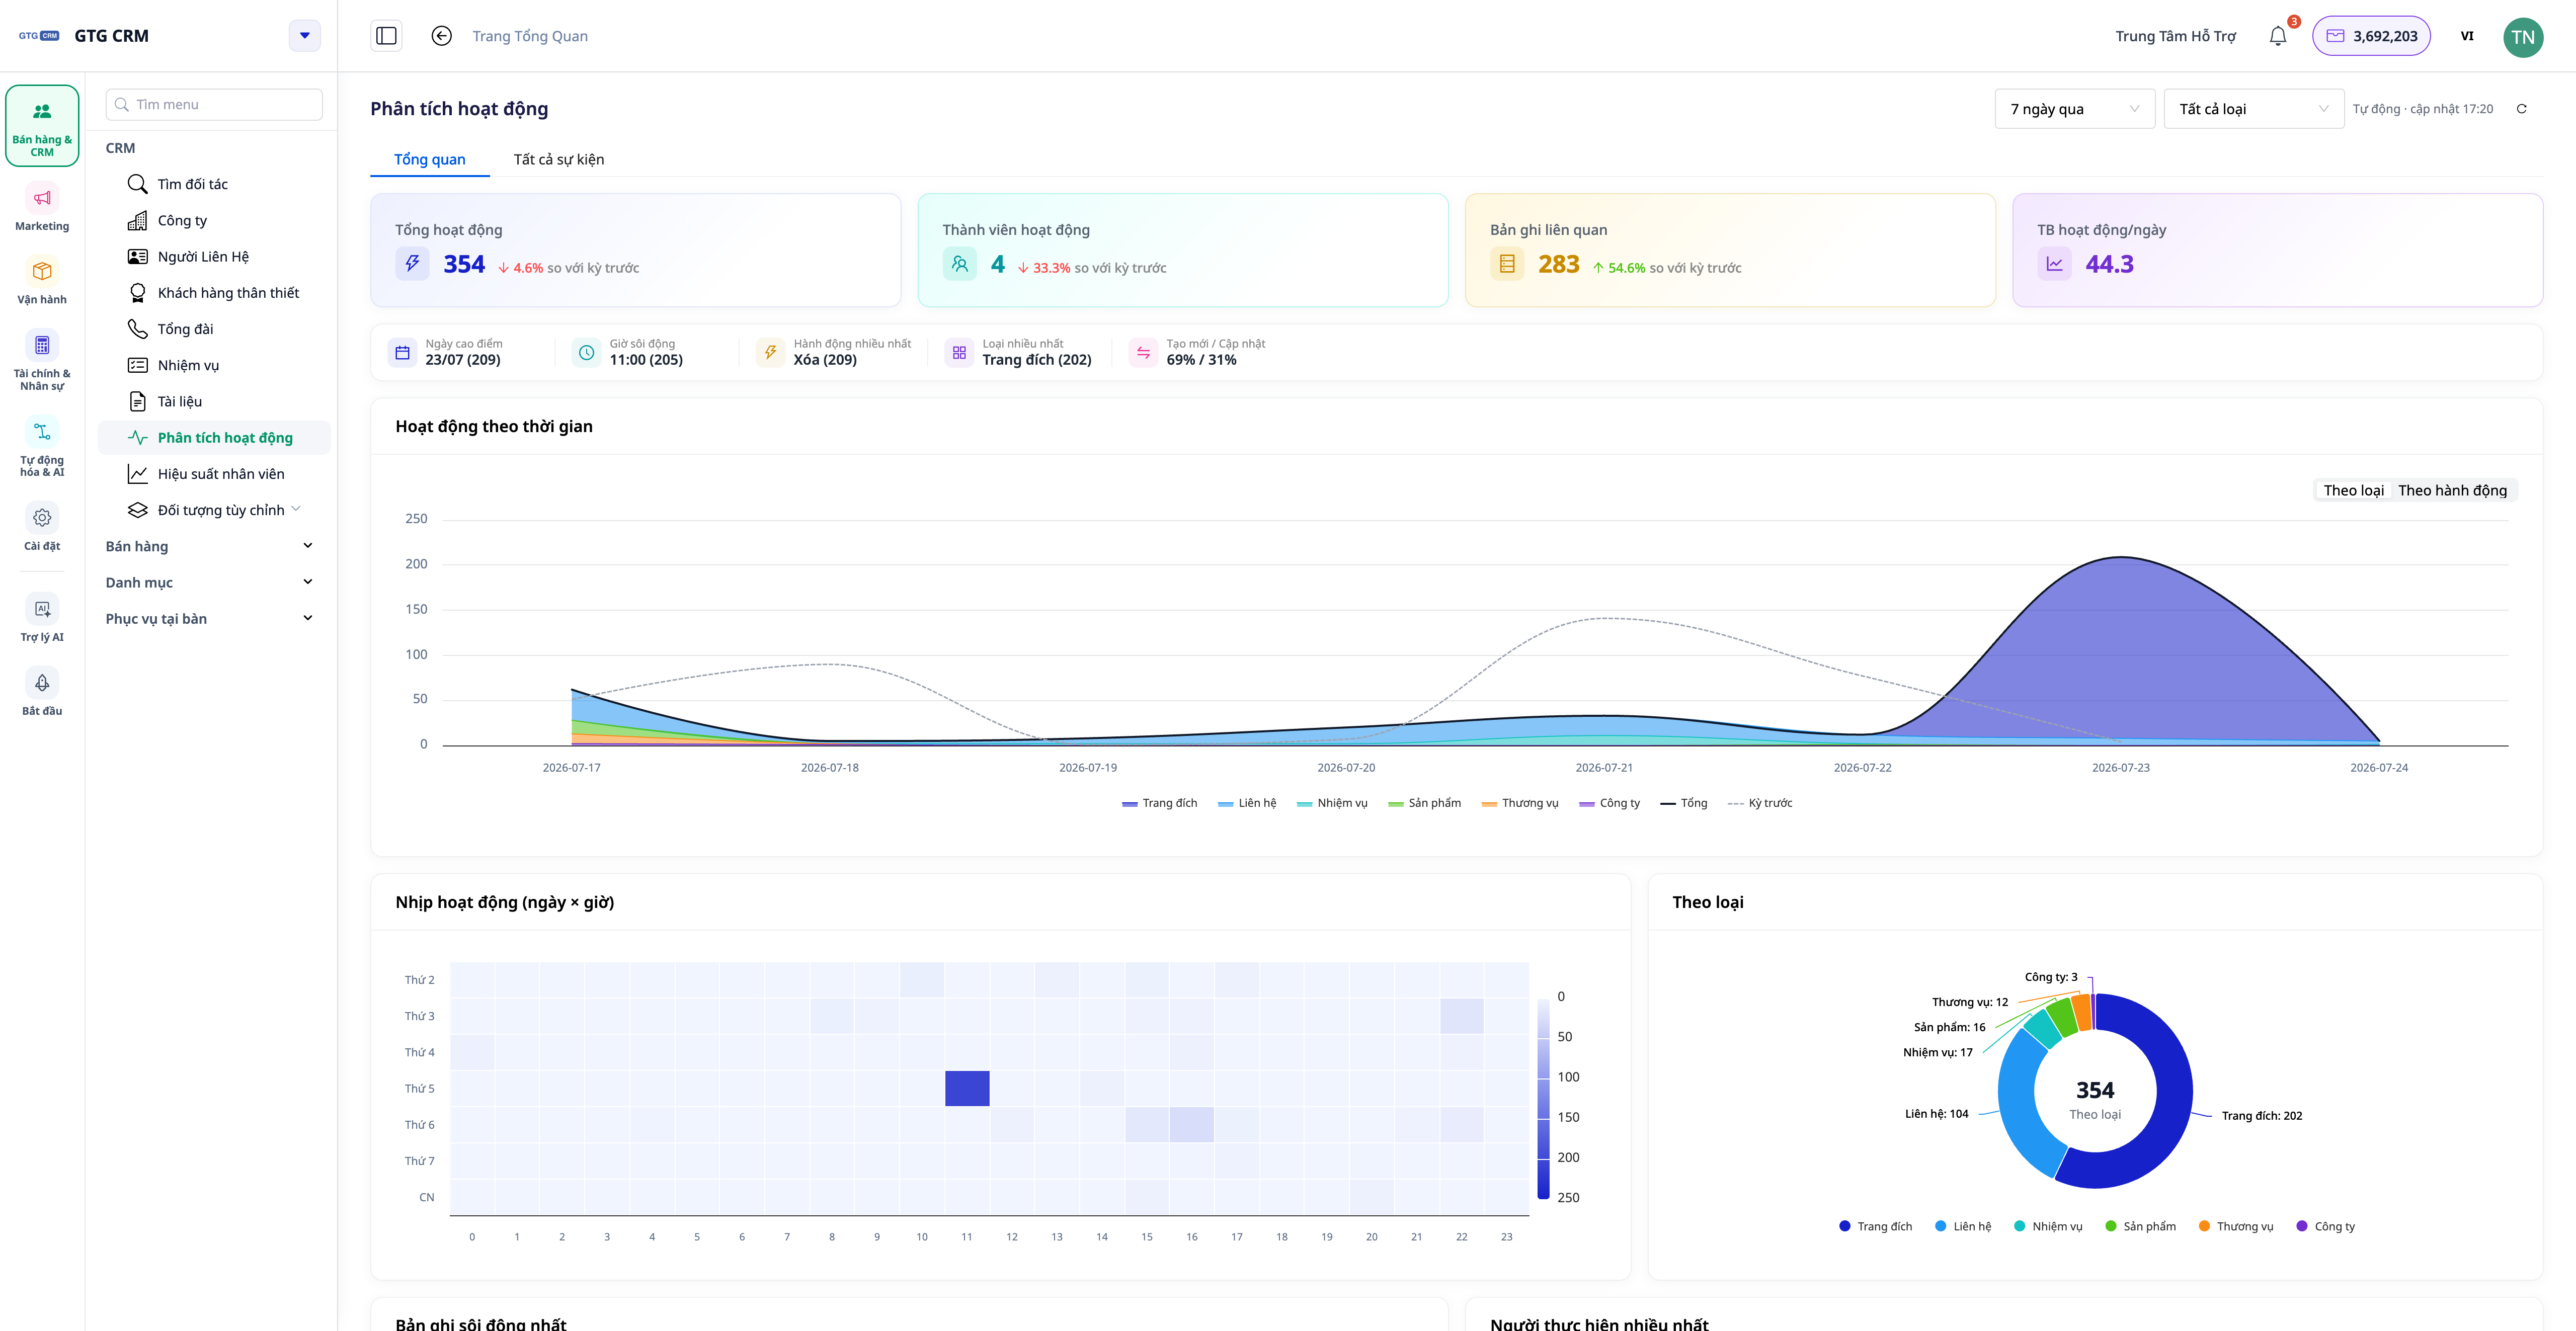
- In the Overview tab, see: KPI trends (with previous period comparisons), highlights (peak days, busiest hours, most popular actions…), component toggle buttons by object/action type, date × time heatmap , busiest record widget (click to go to the 360° page of the record), and rankings by performer .
✅ Expected outcome : The Overview page displays trends, highlights, a date-time heatmap, and rankings; clicking on a busy record will open the specific details page for that record.
💡 CRM dashboards (Analytics, Operational Analytics, etc.) automatically refresh : the top right corner displays "Auto · Update HH:MM" , along with a manual refresh button. You don't need to reload the page to see the latest data.
Quick lookup table for expected results
Create/Import Contacts — Contacts appear in the list; report successful import number.
Advanced (combination) filter — Only matches all conditions.
Open the Analytics (Contact) tab — KPI card + lifecycle funnel + chart; Actual matching total
Click on an Action Suggestion — Go to the Filtered List tab for the correct customer group
Open the Analytics (Business) tab — Charts by industry / size / pipeline
Open the Activity tab for a contact — Timeline with the person's name and clear action.
Open the Company Activities tab — Scroll down the combined contacts/deals/orders timeline.
Activity tab provides a list — General feed, filter by person/type/date, within the workspace.
CRM → Activity Analytics — KPI Trends, Heatmap (Date x Time), Rankings
Leave the dashboard open for a while — The "Auto · update HH:MM" indicator will move automatically, and the data will update automatically.
Note
- The Data Analysis tab calculates the exact numbers across all data—accurate figures at any workspace size (overcoming the previous 1,000 sample limit).
- The Activity timeline in your workspace only displays data within the scope of that workspace .
- The State/Lifecycle values displayed are based on your workspace configuration — these are normalized values for consistent metrics.
- Please enter your full email address/phone number and update your status so that the dashboard and suggested actions accurately reflect reality.
- Make sure the channels (Facebook, Zalo, Email) are connected in Settings so that the CRM automatically synchronizes contacts and timelines with sufficient data.